Financial Report Templates for Pre-Revenue Startups
A practical guide to building financial statements when your startup has no revenue yet.

Think of the balance sheet as a photograph. It captures everything the company owns and everything it owes at a single point in time. Pre-revenue, that photograph is sparse. Sparse doesn't mean useless.
On the assets side, you're looking at almost entirely cash and whatever equipment or intellectual property the founders contributed. No accounts receivable. No inventory. No revenue-generating asset base. Just cash and the stuff you bought or brought in.
On the liabilities side, you'll typically see:
- Founder loans
- Outstanding SAFE agreements
- Credit card balances
- Deferred expenses
That last one trips people up. Deferred expenses are things you've been billed for but haven't paid yet. Real obligations. They go on the balance sheet.
The equity section includes paid-in capital and accumulated deficit. That accumulated deficit will be negative, and it will keep growing. Early-stage companies run at a loss before they run at a profit. That's the whole model.
One thing that genuinely matters here: SAFE notes. Depending on your accounting treatment, a SAFE can sit as a liability or as an equity instrument. Founders need to know which treatment they're using and why, because it changes how your capitalization looks to an investor running due diligence. A Series A investor will catch a mistake there before you've finished your coffee.
The discipline is simple. Update the balance sheet monthly. Not just when you're fundraising. Your accountant shouldn't have to nudge you. Every month. A messy balance sheet communicates something before an investor reads a single other page.
The Income Statement With No Revenue: Tracking the Expense Structure That Will Matter Later
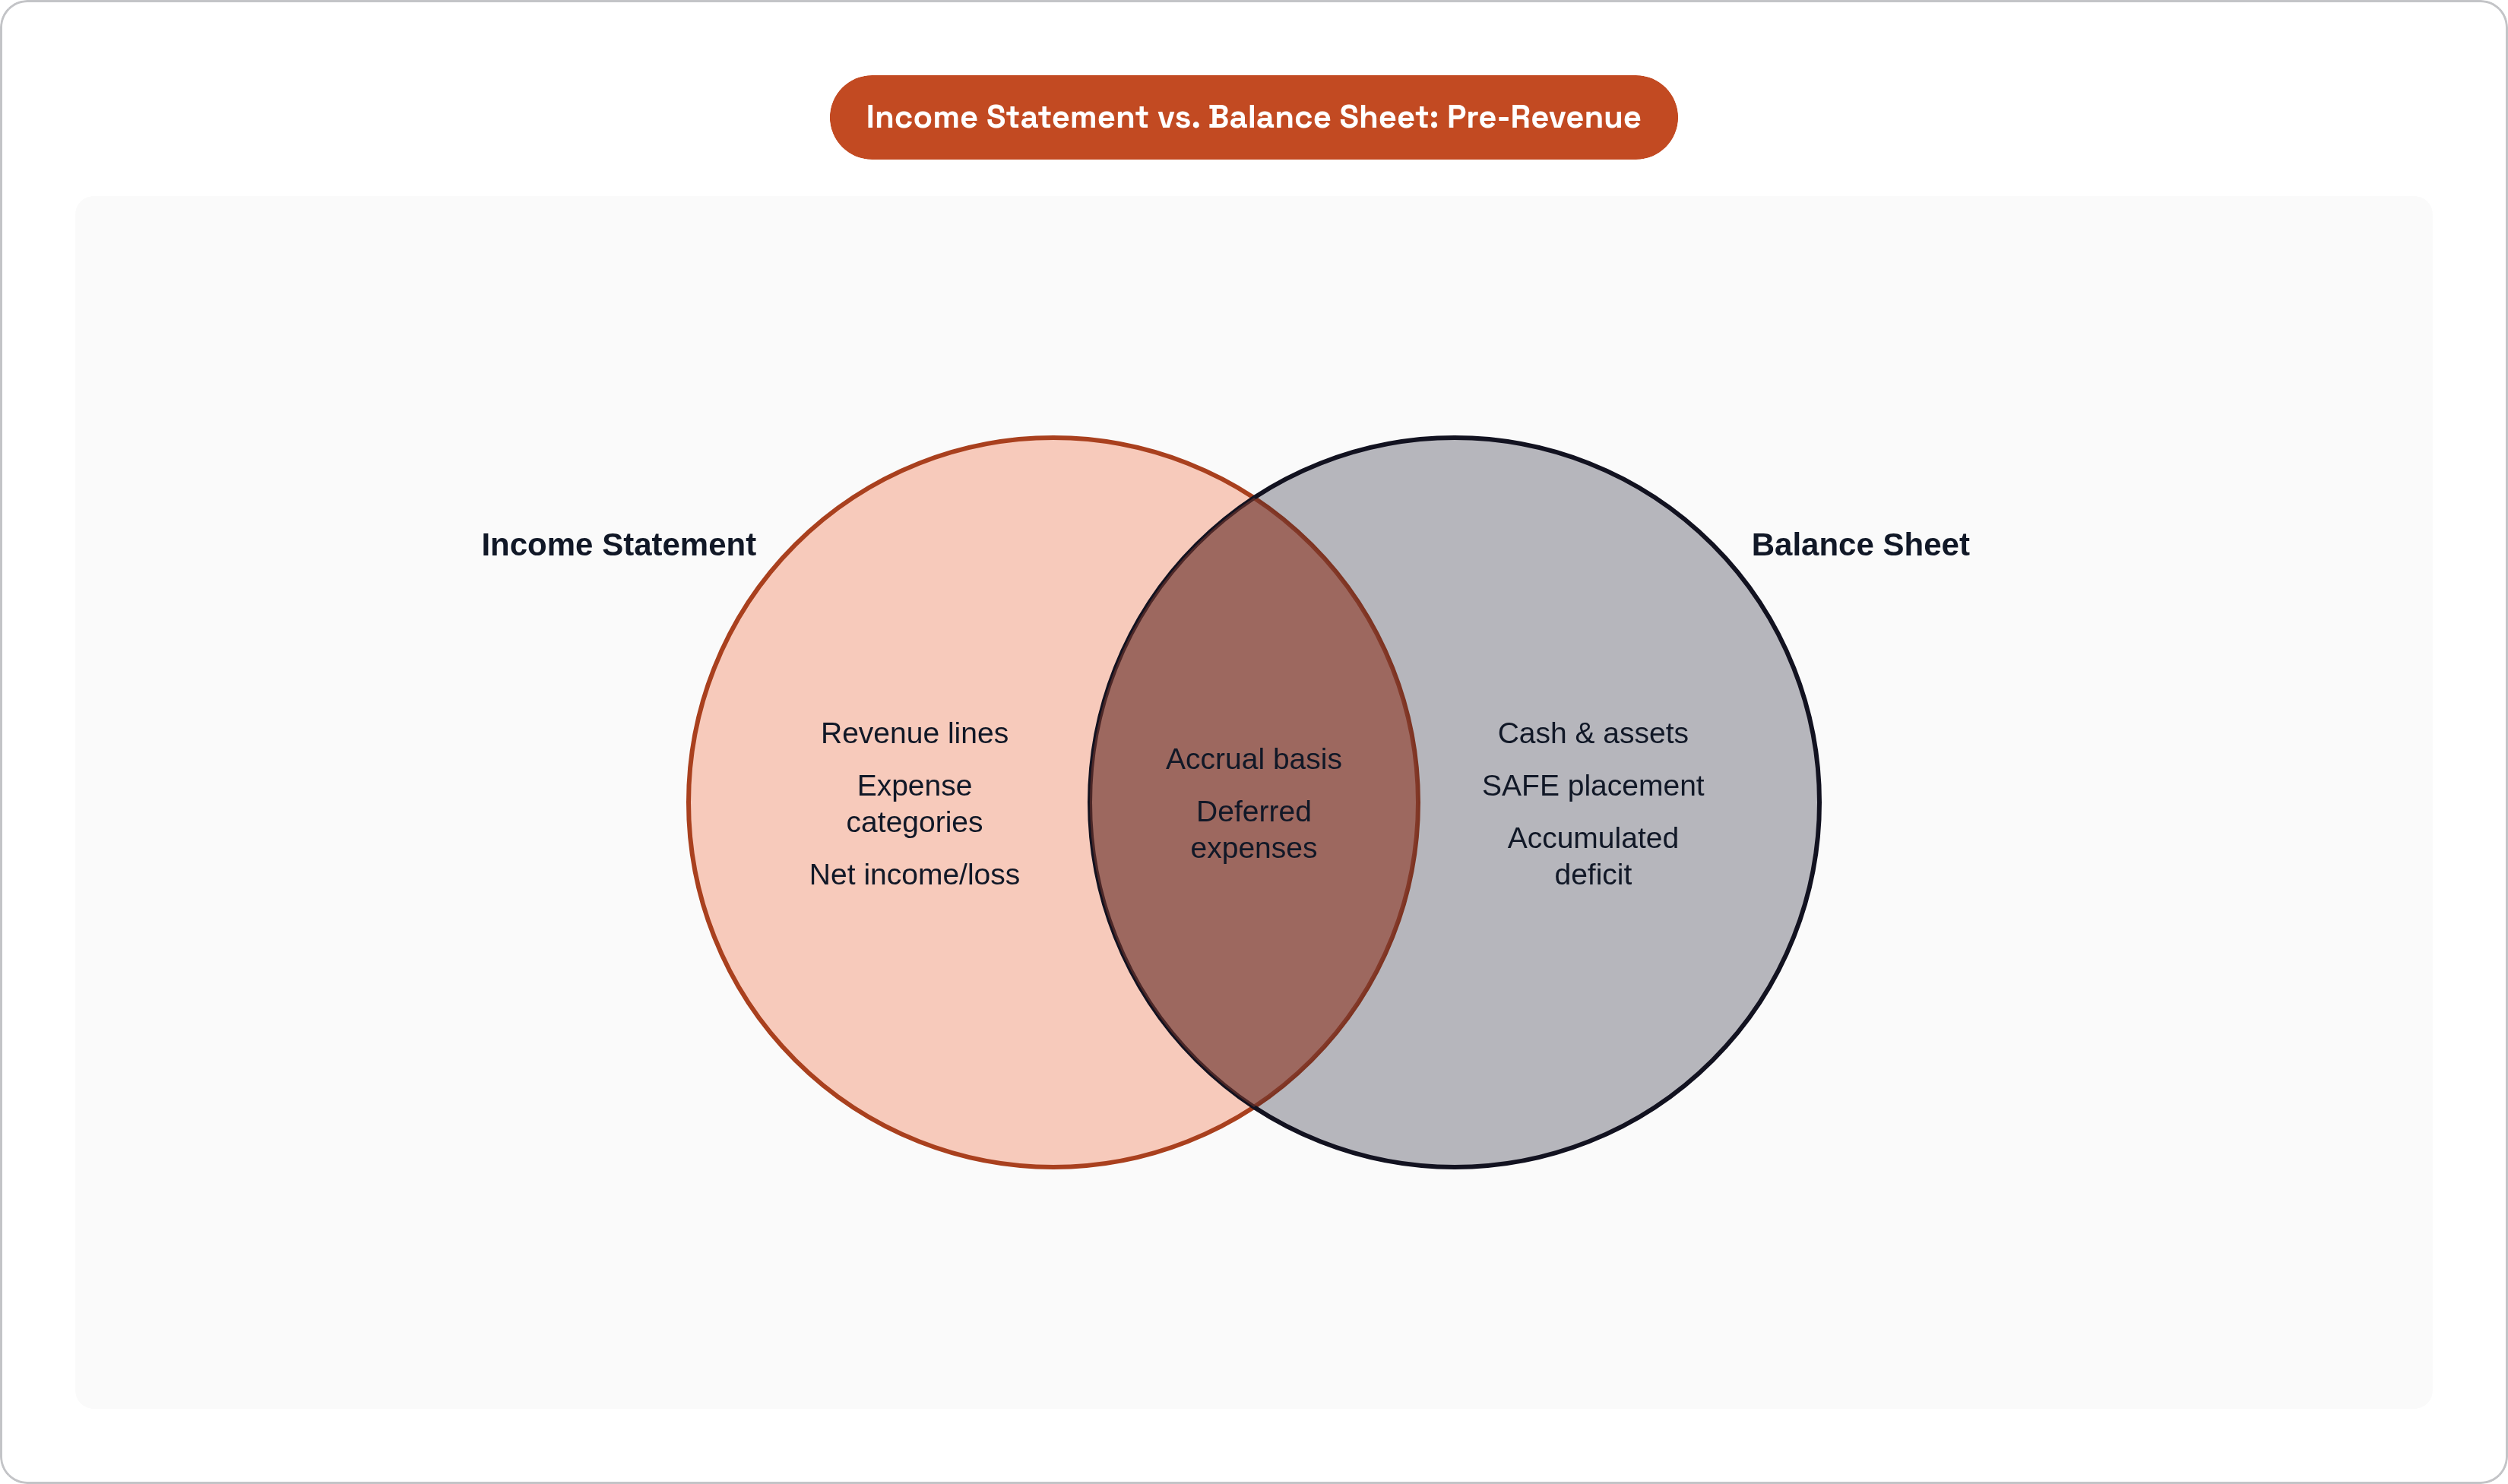
The income statement runs in this order:
- Revenue
- Cost of Sales
- Gross Profit
- Operating Expenses
- Operating Income
- Net Income
Pre-revenue, almost every line is zero or negative. Revenue is blank. Gross profit is blank. Net income is a growing negative number. It can feel pointless, honestly. Like setting a table for a dinner party where no one's coming yet.
Set the table anyway.
The structure forces categorization discipline. Spend six months cramming everything into one vague "expenses" line and retrofitting proper categorization later is genuinely painful. Investors will ask for the breakdown. They always do.
The segmentation that matters most: break operating expenses into R&D, G&A, and S&M. Research and development. General and administrative. Sales and marketing. Even at the earliest stage, this separation shows investors how you're allocating spend. It signals whether you're a product-heavy operation or a sales-heavy one, and that story shapes how they read the business.
Also worth noting on accounting method. Implement accrual accounting from the start, not cash accounting. Accrual means commitments show up when they're incurred, not when cash actually leaves the bank. That software contract you signed last month goes on this month's income statement, even if the invoice hasn't cleared yet. It gives you an honest picture of your obligations.
For Year 1, monthly granularity is the standard investors expect. Quarterly isn't enough.
Burn Rate: The One Number That Defines Your Pre-Revenue Operating Reality
Burn rate is the amount of cash the startup spends each month. Pre-revenue, gross burn and net burn are the same number because there's no revenue offsetting anything. Build both into your template anyway. The day revenue arrives, you'll want that distinction already baked in.
What goes into burn:
- Salaries
- Contractor fees
- Cloud infrastructure
- Software subscriptions
- Office costs
- Legal fees
- Every recurring and one-time cash outflow
People costs are almost always the single largest expense category for an early startup. Headcount is the primary lever you have to control burn. It's also the hardest one to pull, which is exactly why it needs to be visible.
Here's a practical thing that catches a lot of founders off guard: headcount doesn't automatically appear in QuickBooks or most standard accounting software. You have to maintain a separate headcount tracker and reconcile it to payroll manually. Boards ask for this report specifically because it reveals the cost structure and how much flexibility the company has if things go sideways.
A proper headcount report covers:
- Each person's name and role
- Start date
- Monthly fully-loaded cost (salary plus benefits plus payroll taxes)
- Full-time or part-time status
One template design note. Burn rate belongs on a summary dashboard, visible immediately. Not buried three tabs deep in a spreadsheet. If someone has to hunt for it, the template isn't working.
Cash Runway: Translating Burn Rate Into Time
The formula is straightforward.
Current cash balance divided by monthly burn rate equals months of runway.
That number is the most important number in the company right now. If you track only one thing, track that.
Your runway projection should come from a monthly financial model. If that model doesn't exist yet, extrapolate from your current monthly burn as a floor. Key word: floor. Extrapolation assumes flat burn, which is almost always optimistic because hiring ramps and costs grow. Use flat burn as your best-case floor, not your central estimate.
The fundraising timing problem is real. Your runway projection has to account for when the next round needs to close, and you have to work backward from the milestones investors will need to see before they commit. A lot of founders who've been through YC use a simple rule: start fundraising when you have six months of runway left. Not two. Not three. Six. Because the process takes longer than you expect, every single time.
Your template should include a rolling 12-month runway chart, updated monthly. Not just today's number. The full trajectory:
- Cash in bank by month
- Projected burn by month
- Projected end-of-cash date
Then add scenario columns:
- Base case: current hiring plan
- Conservative case: no new hires
- Aggressive case: next hire made in 60 days
Those scenarios aren't pessimism. They're intellectual honesty. Investors read them as a sign that you understand your own risk profile rather than just hoping things work out.
The Cash Flow Statement: Where Promises Become Real Money Movements
The income statement tells you what was earned and spent on an accrual basis. The cash flow statement tells you when cash actually moved. Those are two different things, and the gap between them is where founders get into trouble.
Three sections:
- Operating activities: cash used to run the business
- Investing activities: equipment purchases, IP acquisitions
- Financing activities: SAFE proceeds, loans received
Pre-revenue, operating cash flow will be negative. The template should make that visible and expected, framed clearly so it doesn't read as alarming to someone reviewing it fresh.
The financing activities section is where SAFE proceeds appear. When an investor wires money on a SAFE, it shows up here as a cash inflow. This matters for your runway calculation in a specific way: SAFE money received but not yet deployed sits on your balance sheet as cash and in financing activities on the cash flow statement. Founders sometimes double-count it or miss how it flows through, and both errors come up in diligence conversations at the worst possible moment.
The more common mistake, though, runs the other direction. Do not treat a signed SAFE as cash before it funds. A signed document is money nowhere near the bank. The cash flow statement enforces honesty about what's actually available, which is the whole point of maintaining it.
One reconciliation check worth running every month: the ending cash balance on your cash flow statement must match the cash line on your balance sheet. If it doesn't, something is wrong upstream. Find it before anyone else does.
Financial Projections: How to Build a Forward-Looking Model Before You Have Historical Data
Investors expect projections before you've generated a dollar of revenue. Not because they trust the numbers. They want to see how you think.
Minimum time horizon for a professional investor conversation: three years. Monthly detail for Year 1. Quarterly for Years 2 and 3.
Pre-revenue, you're starting with top-down forecasting. You begin with market size and capture-rate assumptions because there's no sales history to build from. That's fine. It's the only honest starting point when real data doesn't exist.
The limitation is real, though. Top-down forecasting relies on averages and market trends that won't match your specific go-to-market reality. Acknowledge that directly in your model's assumptions tab. Investors aren't surprised that a pre-revenue forecast is imprecise. They are surprised when founders pretend otherwise.
Build the model to transition from top-down to bottom-up as soon as real user and conversion data exists. That shift is a visible sign of a maturing business, and investors notice it.
If you're building SaaS, structure the model around actual MRR drivers even before revenue:
- Projected users
- Conversion rate
- Average revenue per user
- Churn
Not just a revenue line with a growth percentage bolted on. That's not a model. That's a guess in a spreadsheet.
What investors actually test in a pre-revenue model is the assumptions, not the output numbers. Every input cell should be labeled. Every assumption should be defensible out loud, on the fly, in a meeting where someone is pushing back. A separate assumptions tab is not optional. It's where the real work lives.
Budget-Versus-Actual Tracking: The Discipline That Makes Projections Useful
A projection without variance tracking is just a document you made once and never looked at again.
BVA (budget-versus-actual) works like this: every month, compare what you projected to spend against what you actually spent. That's the whole thing. The value comes from doing it consistently, not from doing it perfectly.
Pre-revenue, this builds the accountability habit before the stakes are high. It also surfaces where your assumptions were wrong before those errors compound into something larger and harder to explain.
A related tool worth building into the template is waterfall analysis. This tracks how your forecast has evolved across periods. Not just the gap between budget and actual, but how the forecast itself has shifted over time. What you thought revenue would be in March versus what you thought in January versus what it actually was. The direction of errors is more useful than just the size of them.
Waterfall schedules should cover:
- Expenses
- Cash position
- Revenue and ARR as the company grows
For the practical template design: a rolling table where each month adds a column. Actuals in one color. Prior forecast in another. Variance calculated automatically. Keep it simple enough that you'll actually update it every month.
Variance analysis tells real stories. Overspend in G&A often means infrastructure costs scaled faster than planned. Overspend in R&D may mean MVP scope crept. Those are different problems with different fixes, and the BVA report is what makes a monthly founder check-in a real conversation rather than a vibe check.
The KPI Dashboard Section: Non-Financial Metrics That Contextualize the Financial Picture
Cash spend without context is almost meaningless. Spending $80,000 a month looks very different if you're growing weekly active users rapidly versus sitting completely still. The financial statements don't tell that story. The KPI dashboard does.
For a pre-revenue startup, the metrics worth tracking in the template include:
- User signups
- Activation rate
- Weekly active users
- Waitlist growth
- Pilot customer count
- NPS or Sean Ellis score
On activation rate: the average SaaS product activates roughly 37% of new users, which gives pre-revenue founders a calibration point. Running below that in early pilots means the product isn't converting people who showed up to try it. Running meaningfully above it is a signal worth putting in front of investors.
The Sean Ellis test measures product-market fit by asking users how they'd feel if the product disappeared tomorrow. If 40% or more say "very disappointed," that's meaningful. If you've run that test, the result belongs in your financial package. It's a signal that reframes everything the financial metrics say.
Here's the connection that actually matters. The conversion assumptions in your revenue model need to be rooted in actual early activation and retention data. If your model assumes a 15% paid conversion rate and your early pilot data shows 3%, those two numbers are in direct conflict. An investor will find that conflict, and they'll find it before you'd like them to.
In the template, the KPI dashboard sits alongside the financial statements. Not buried in a back tab. It's the narrative layer that explains the numbers. As companies grow, KPI dashboards often become the primary board meeting document, with financials as supporting detail. Building the habit early is worth it.
What Investors Look for in a Pre-Revenue Financial Package
SAFEs dominated pre-seed deal structures in Q1 2025, comprising roughly 90% of all pre-seed deals on Carta. If you're raising pre-revenue, you're almost certainly on a SAFE, which means your financial package needs to justify a valuation cap rather than a priced-round valuation.
What justifies a valuation cap with no revenue? The quality of your model's assumptions. Your burn efficiency. The cost structure visible in your headcount plan. The early traction signals in your KPI dashboard. Median valuation caps on post-money SAFEs for rounds in the $250K to $1M range were around $10 million in 2025. Your financial package needs to tell a coherent story that supports whatever cap you're asking for, because someone is going to push on it.
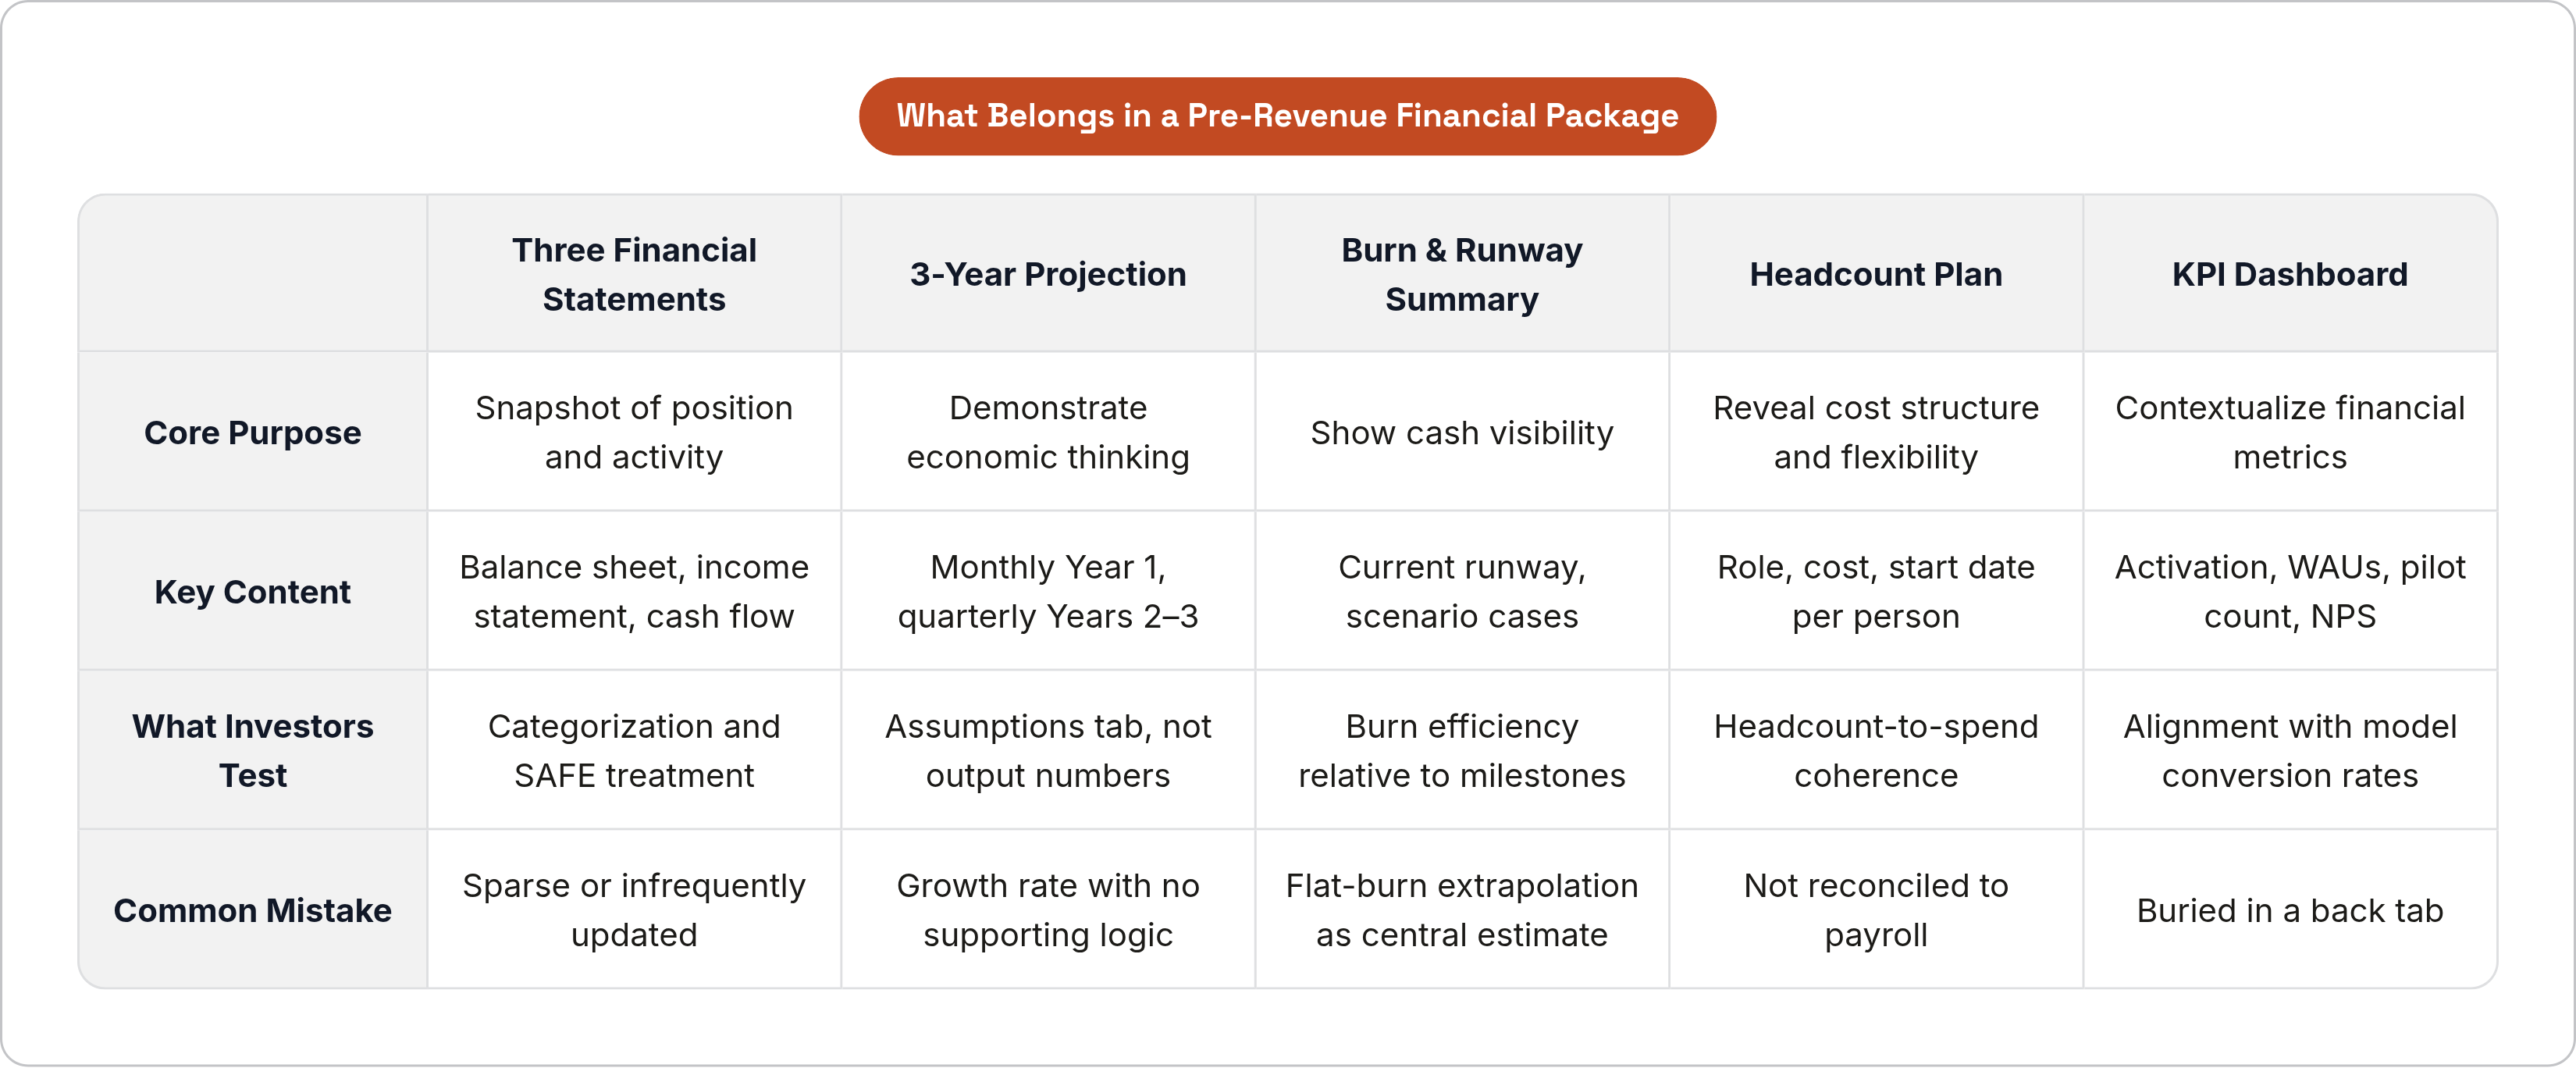
The package investors expect:
- Three financial statements (even if sparse)
- A 3-year projection with monthly Year 1 detail
- A burn and runway summary
- A headcount plan
- A KPI dashboard
What signals founder quality in that package has nothing to do with big revenue projections. Clean categorization signals it. Labeled assumptions signal it. Honest variance tracking signals it. Optimistic projections with no supporting logic signal the opposite.
The 3-year projection horizon isn't about accuracy. Nobody knows what Year 3 revenue will be. The point is demonstrating that you understand the economics of the business you're actually building, not the business you're hoping to build. Investors are reading the model to understand the founder's thinking. That's the only thing they're actually reading it for.
One practical note for anyone building these templates right now: a meaningful number of accounting rule changes are scheduled to take effect on mandatory dates between 2025 and 2028. Build in flexibility. The standards you're reporting against will evolve, and retrofitting a rigid template is its own kind of pain.