Unit Economics Benchmarks for Pre-Revenue Startup Models
Investors check three unit economics metrics before you land a customer.

Before a founder says a word in the pitch meeting, the investor across the table has already picked three numbers to check the story against. No revenue has to exist for that to happen. The bar has moved: a CAC payback period above 18 months or a SaaS gross margin below 50% now reads as a red flag at the seed stage, and by Series A, 60%+ gross margin is the floor, not the goal. None of that requires a single paying customer. A founder can estimate target LTV from pricing plans and expected retention, and can estimate CAC from early marketing tests, well before launch. Showing that work in a deck is what tells an investor this founder understands the economics of one customer, and that's the thing being tested in the room, not whether a bank account has money in it yet.
What the pre-revenue stage looks like in benchmarks
Most pre-revenue startups are run by about two and a half full-time people, on thin margins, with a runway measured in months, not by a polished team with a deep bench. That means the job of modeling LTV, CAC, and gross margin usually falls on one person, often the founder, with no finance team to lean on. Global VC hit near-record levels in 2025, the third-highest annual total on record, but that number says almost nothing about what a typical pre-revenue founder is facing. The vast majority of Q1 2026 VC deal value went to AI companies, and non-AI founders are raising in a market far tighter than the aggregate suggests. Geography narrows it even further: the overwhelming majority of that same Q1 2026 deal value landed in a handful of major U.S. hubs. The benchmarks that follow aren't abstract targets pulled from a textbook. They reflect what investors see, deal after deal, across a large pool of real companies in this exact spot.
The three unit economics benchmarks every investor applies regardless of stage
Strip away industry, business model, and stage: three numbers remain constant, LTV:CAC ratio, gross margin, and CAC payback period. Every investor checks these first, and a pre-revenue founder needs a projection for all three before walking into the room.
Start with LTV:CAC. A healthy SaaS business targets a ratio of at least 3:1. Companies under roughly $2M ARR get some room, operating at 2:1 to 3:1 while they're still proving product-market fit, because at that size a founder is buying information about the customer as much as buying the customer itself.
Gross margin comes next, and it carries more weight than its place on the list suggests. For SaaS, the target is above 70%; anything below 60% is a red flag no matter the stage. Every downstream number, LTV, CAC payback, contribution margin, is built on top of gross margin. If a founder can't defend the gross margin assumption, nothing calculated from it holds up.
CAC payback period is where the ratio meets cash flow. A 3:1 LTV:CAC ratio looks great on a slide, but if payback takes 36 months, the company is still bleeding cash for three years before that customer breaks even, and early-stage companies don't have three years of runway sitting around, which is what payback period measures: how fast the bleeding stops.
The usual pushback is that a pre-revenue founder can't know any of these numbers with real data behind them. Investors aren't asking for actuals. They want reasoned projections built on visible assumptions, numbers a founder can walk through and defend line by line.
How AI-native startups face different thresholds
Applying the SaaS gross margin target of 70%+ to an AI-native product without adjustment makes the resulting model either misleading or impossible to defend in diligence. A traditional SaaS product costs almost nothing extra per additional user. An AI product's compute cost is a permanent feature of how the product runs, not a bug that gets fixed with better engineering.
AI-native unit economics run on five metrics instead of the usual SaaS set: cost per inference, AI COGS ratio, gross margin after compute, compute-adjusted LTV, and the ratio of LTV to compute-adjusted CAC. AI COGS ratio answers a simple question: what share of revenue gets eaten by compute? Gross margin after compute answers the question investors in this category actually care about: once the GPU bill is paid, what's left?
At seed stage, typical AI COGS ratios run 35–50%, and gross margin after compute is around 40–55%, well under the 70%+ SaaS benchmark, but that's the right number to measure against for this category, not a shortfall against SaaS. The range shifts by product type: data analytics or BI tools built on AI tend to run 60–75% gross margin after compute, while image or video generation tools run lower, 45–60%, because the compute cost per output is so much higher.
Compute-adjusted LTV fixes a blind spot in the standard LTV formula by subtracting actual compute cost per user instead of applying one flat margin across the board. A power user making hundreds of API calls a day costs far more to serve than someone who logs in twice a week, and that gap adds up fast across a full customer base. The LTV:CAC target itself doesn't move, still 3:1, but getting there is harder because compute costs eat into LTV from the start. An AI founder needs lower churn, higher ARPU, or a cheaper CAC than a SaaS founder just to reach the same ratio.
One objection comes up constantly: margins will improve as model costs fall. That may well be true over time. Investors are pricing the model against today's compute costs, not tomorrow's, and a founder who can't show acceptable margins under current pricing is asking investors to bet on a cost curve nobody in the room controls.
Stage-by-stage benchmarks: what investors expect from pre-seed through seed
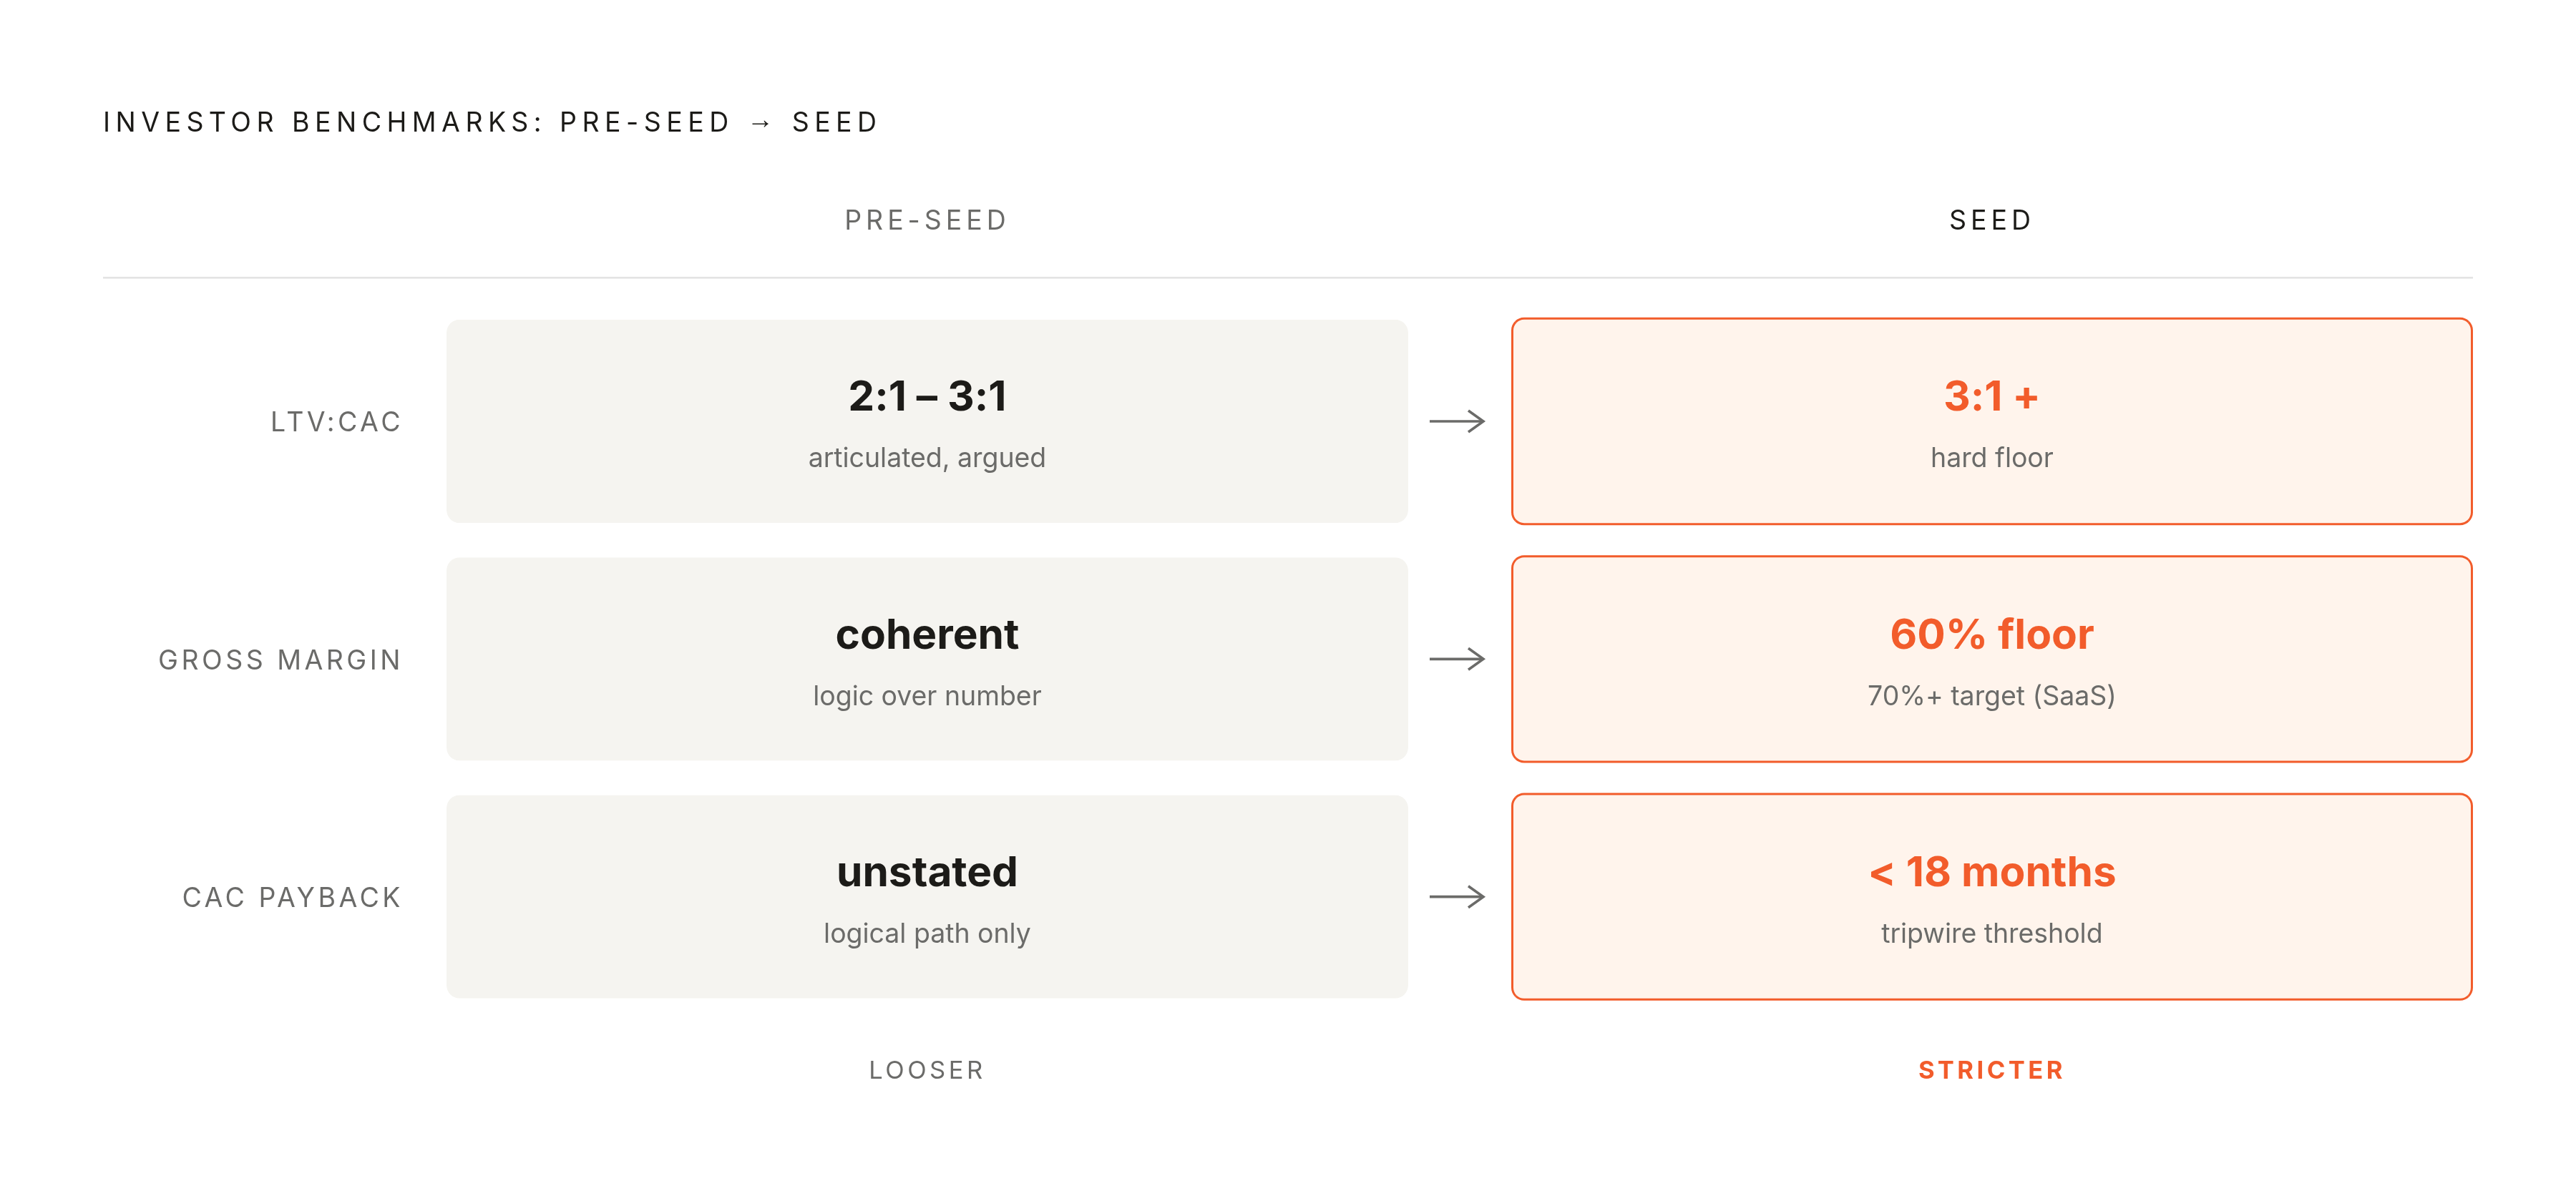
The same three benchmarks get weighed differently depending on what stage a company is raising at. What passes at pre-seed turns into a problem by seed, and a founder who doesn't track where that line moves ends up raising too early or chasing the wrong target.
At pre-seed, the standard instrument is now a post-money SAFE with a valuation cap and no discount, with median caps running around $10M for smaller rounds and $15M for larger ones. Investors at this stage are betting on the founder and the problem, not on revenue, but they're still checking whether the unit economics model holds together logically. The bar is articulation: can this founder lay out LTV, CAC, and gross margin as reasoned projections with assumptions stated clearly? That's the whole test at pre-seed. Execution comes later; coherent thinking is what's graded now.
Seed looks different. Median seed pre-money valuation hit $18.4M per PitchBook-NVCA's Q1 2026 data (the 2025 Carta figure was $16M), with a median cash raise of roughly $3M to $4M depending on the dataset. Seed investors want product-market fit signals and real early evidence behind the unit economics, not just a coherent story. CAC payback above 18 months and SaaS gross margins below 60% now get cited explicitly as reasons to extend runway and wait. A well-timed raise with strong numbers closes faster and on better terms than an early raise with thin ones. The median gap between seed and Series A has stretched to around 616 days, and investors aren't punishing founders for taking that extra time to get the numbers right.
Founders should also model dilution alongside unit economics at each stage, so the equity cost of raising early is visible before the model has had time to mature.
Retention and growth rate benchmarks that pre-revenue models must project forward
A snapshot of LTV:CAC and gross margin tells an investor where a company stands today. Retention and growth rate tell them where it's headed, and that trajectory is just as much a part of diligence as the static numbers.
Retention benchmarks vary by business model. Mid-market SaaS runs monthly churn of 1–3% with net revenue retention (NRR) of 105–115%. Enterprise SaaS runs tighter: churn under 1%, NRR of 115–130%. AI-native startups at seed stage typically see monthly churn of 4–6%, which tracks with how much experimentation happens early in AI product adoption, customers testing, switching, testing again. (Consumer apps run on their own retention curve entirely, with day-30 retention and DAU/MAU ratios mattering more than churn, but that's a different conversation from the B2B and AI-native models most pre-revenue founders are building.)
NRR above 120% changes the conversation with investors completely. At that level, existing customers are generating more revenue year over year before a single new account gets signed, and companies hitting that number command materially higher valuations. A pre-revenue founder who can show a pricing and retention model pointed at that range walks into the room with a structural edge over one who can't.
Growth rate matters too. Investors have standardized around month-over-month growth of 15–20% or higher at seed, as long as it's defensible with data behind it.
The common objection is that pre-revenue founders have no retention data to ground any of this. True, but the fix is straightforward: tie retention assumptions to comparable benchmarks for the business model and segment, and say so out loud. If an investor sees a pre-revenue model assuming 0.5% monthly churn for a self-serve SMB product, they won't buy it. The same investor looking at 4% churn, with a note reading "projecting toward the SMB median of 3–5%," sees a founder who's actually done the homework.
CAC benchmarks and the channel choices that determine whether a model is fundable
A pre-revenue unit economics model rises or falls on its CAC assumption, and most founders anchor that assumption to the channel they wish they could afford, ignoring what acquisition actually costs.
B2B SaaS CAC has climbed sharply as paid search costs have risen a lot since 2019, and paid acquisition has turned into an expensive default that early founders reach for without checking the alternatives. The gap between channels is stark. Referral and word-of-mouth CAC for B2B runs in the low hundreds of dollars, well ahead of every other channel on efficiency. Paid search, by contrast, averages over $800 for B2B. A model that plans to acquire customers mainly through paid search but prices CAC as if it were running on referrals will not hold up under diligence.
This doesn't mean paid acquisition is off the table. So a model built entirely around paid channels at early scale carries a CAC payback problem baked in before the company has even launched. A founder should be able to show a blended CAC across the actual mix of channels they plan to use, with organic and referral channels weighted at a realistic share of the total.
A convincing pre-revenue CAC assumption has three parts: a specific channel hypothesis, a CAC estimate for that channel pulled from a comparable benchmark, and a payback calculation landing under 18 months at the intended price. Tracking should start before revenue exists, not after. Unit economics need monthly tracking, not just a check-in at fundraising time, because a problem caught at 50 customers is a fix; the same problem at 50,000 customers is a crisis. A founder who builds the habit of tracking CAC before launch ends up with better data, sooner, than one who waits for the first dollar to show up.
Structuring a pre-revenue model that survives investor scrutiny
A pre-revenue model doesn't need actual numbers to hold up. It needs visible assumptions, grounded projections, and a structure that shows an investor the founder understands the economics of a single customer before chasing a thousand of them.
Build it in order, starting with one customer. What does it cost to acquire them (CAC)? How much do they pay (ARPU)? How long do they stick around, expressed as monthly churn? What does that imply for LTV? Layer gross margin on top to turn that revenue number into a defensible LTV: the 70%+ target for SaaS, or gross margin after compute for AI-native products. From there, calculate LTV:CAC and CAC payback. If the ratio comes in under 3:1, or payback runs past 18 months, that's a problem to fix in pricing, retention, or channel strategy before the pitch, not during it.
Every assumption needs a benchmark behind it. "Projecting 3% monthly churn, in line with the SMB self-serve median" is defensible. "Projecting 1% because the product is sticky" is not, because it has nothing to check it against. CAC assumptions should map to the channels a founder actually plans to use, cross-checked against known channel costs. AI-native founders have an extra layer: model cost per inference directly, show the AI COGS ratio, and project gross margin after compute, since investors in this category now expect those five metrics as the standard set.
The bar moves by stage. At pre-seed, the model gets graded as a test of thinking, checking whether the assumptions are coherent and grounded in something real. By seed, early actuals should start to replace the biggest assumptions in the model. If 30 to 90 days of real data exist, that data belongs in the model, not the original guess.
None of this stays static once it's built. Tracking five core metrics weekly, MRR, customer count, churn, CAC, and ARPU, before and after launch builds the data foundation that turns assumptions into actuals faster. A founder who builds that tracking habit pre-revenue shows up to the first serious investor conversation with a model that's already being stress-tested in real time, not one that got built for the pitch deck and never opened again.


