Churn Rate Analysis for Early-Stage SaaS Startups
Compare your churn against companies at your stage, not blended SaaS averages.

Most founders learn their churn rate the same way: they run a report, post the number in a team channel, and get fifteen different answers about whether it's fine. The truth is that most early-stage churn comparisons are made against the wrong baseline. If you measure against a number that doesn't apply to your stage, your customer segment, or your pricing model, you get false comfort or false panic. Neither one helps you fix anything.
Why churn benchmarks mislead early-stage founders before they even start measuring
The headline churn figures that circulate in founder communities are annual numbers covering all SaaS companies. They're not wrong. They just describe a different cohort entirely. When you hold your monthly early-stage rate up against a blended annual average, the comparison is meaningless before it starts.
Three variables determine which benchmark row actually applies to your company. The first is your ARR band, which tracks your stage. The second is your average revenue per account, also called ARPA. The third is your go-to-market motion: whether you run self-serve or sales-led. SaaStr Flywheel's 2026 benchmark grid structures the comparison this way on purpose. Stage, ARPA, and motion sit on three separate axes, not one blended figure.
A self-serve product at low ARPA will carry higher churn than a sales-led enterprise contract. That's not because the product is worse. Contract length and switching costs differ fundamentally between those two motions. A customer on a month-to-month plan can leave in thirty days. A customer in a twelve-month enterprise agreement can't leave without a procurement cycle. Each pair answers a different question.
The stage-appropriate baseline: what early-stage churn actually looks like
Early-stage SaaS companies face structurally higher churn than the benchmarks most founders cite. That elevation is expected. The real question is whether you recognize it as developmental or misread it as normal. The other leads to complacency.
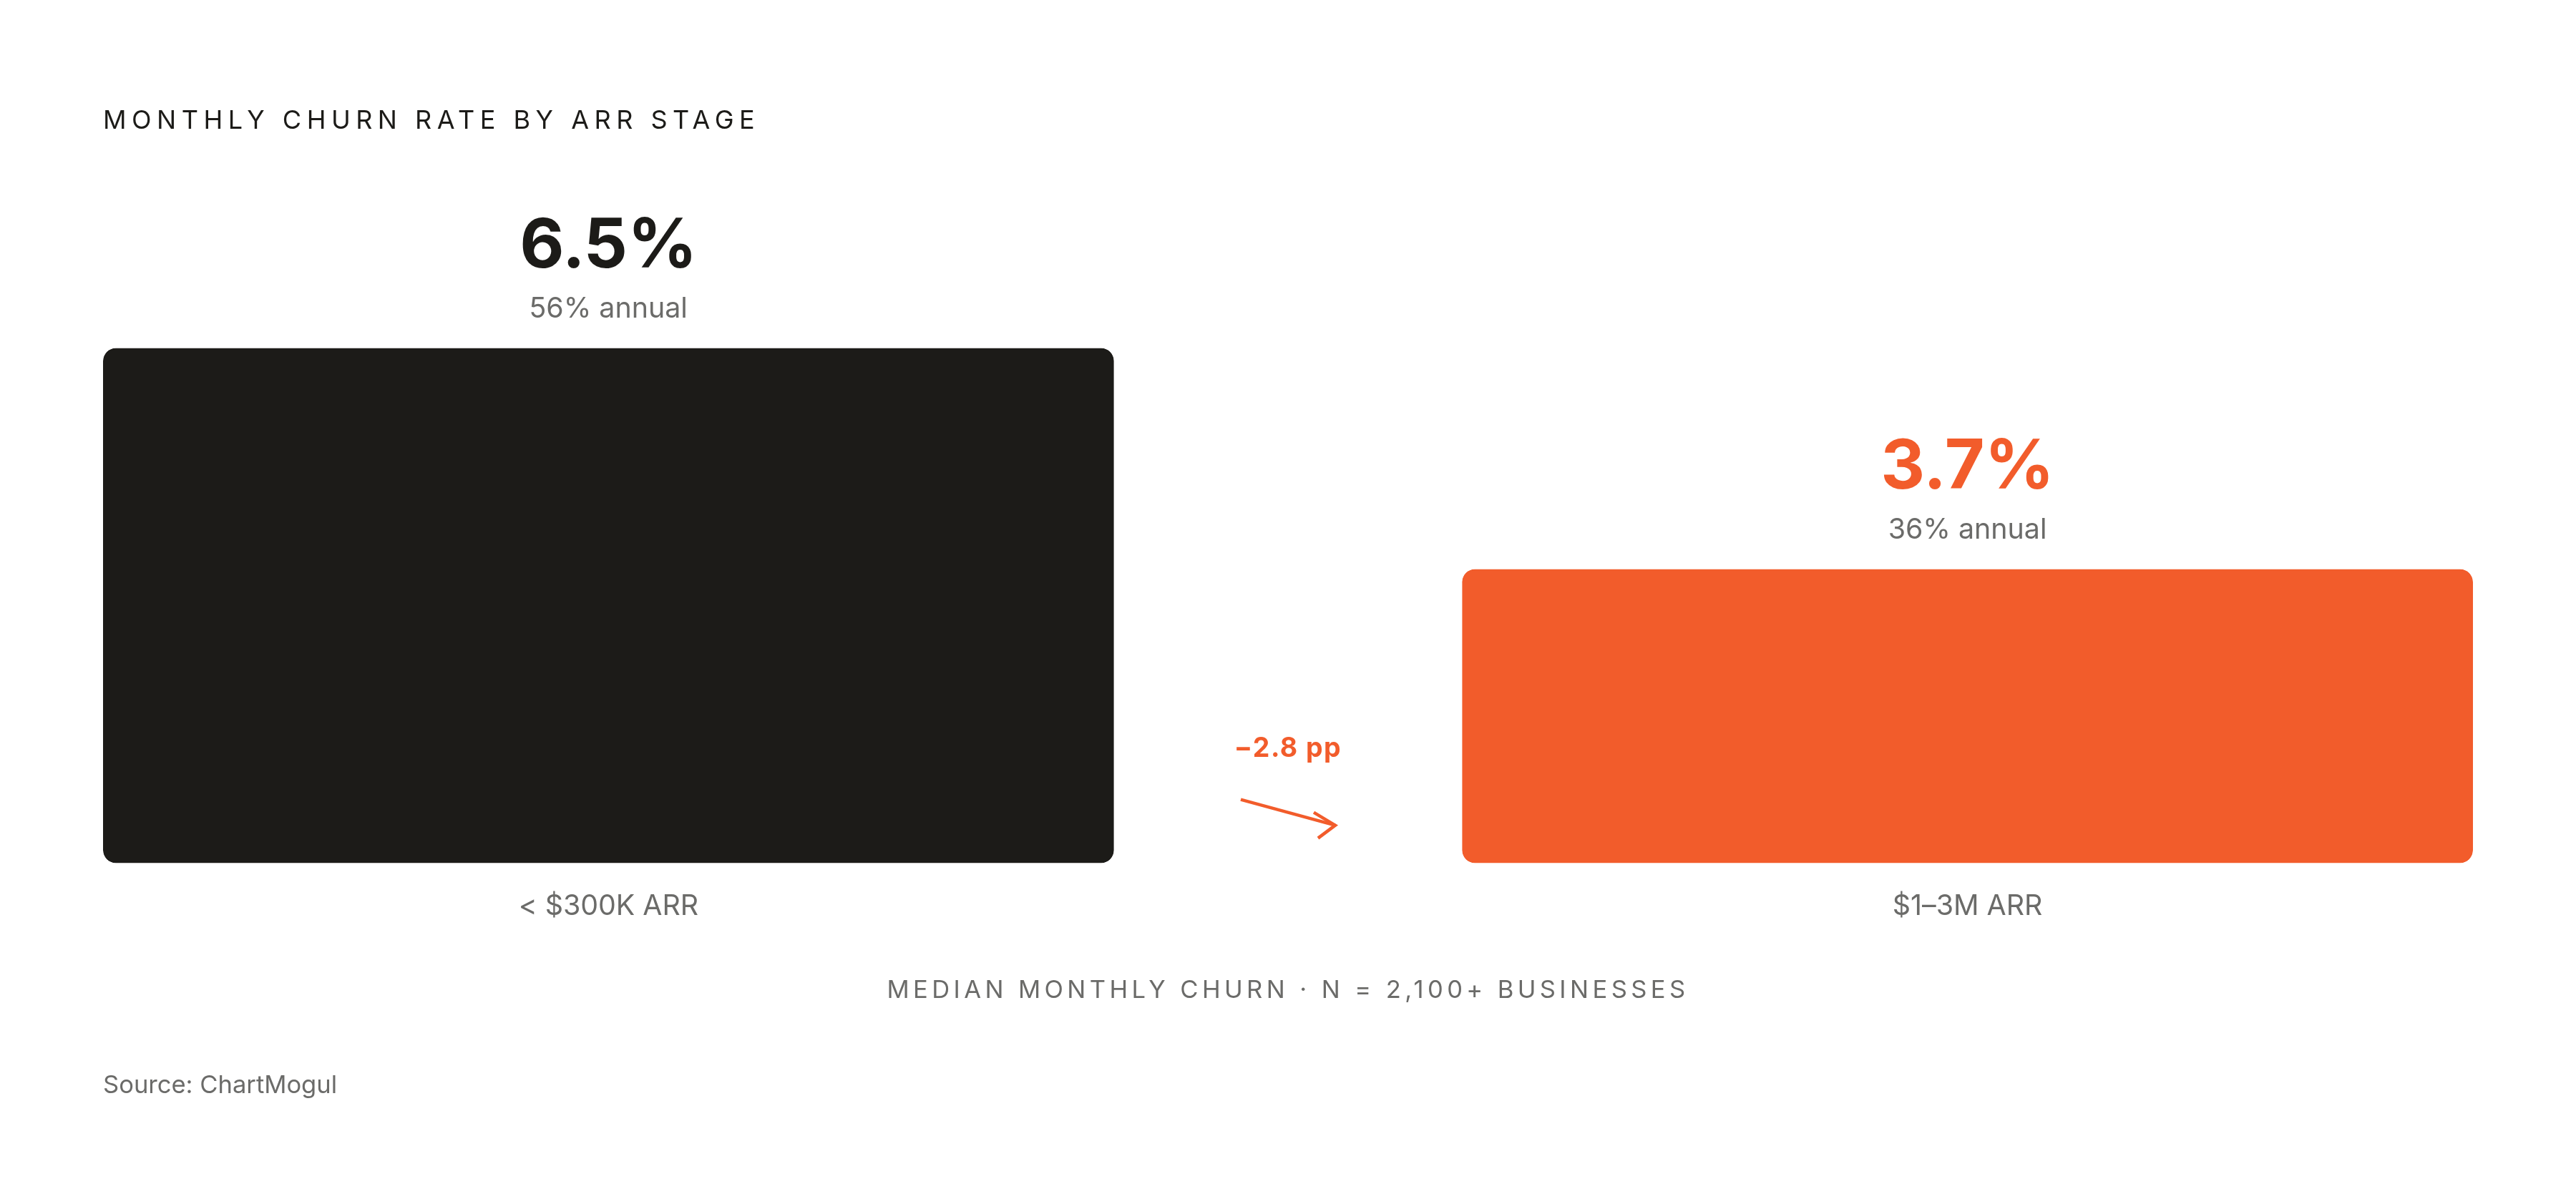
By ARR band, the pattern holds across sources. ChartMogul data from over 2,100 businesses shows that companies below $300K ARR see a median of roughly 6.5% monthly customer churn. Compounded, that's roughly 56% annual customer loss. At $1–3M ARR, median monthly customer churn falls to roughly 3.7%, which compounds to roughly 36% annually. That's still meaningful, but it's a different business entirely.
The drop isn't gradual. The largest single improvement happens between early and growth stages. ACV shows the same inverse relationship. Accounts paying under $25 per month median churn at roughly 6.1% monthly. Accounts above $1,000 per month churn at roughly 1.8%. That structural gap exists before any retention effort is made. It's baked into the customer type, not the execution quality. One caution before moving on. Watch logo churn first.
Four distinct churn metrics and which one to track at each stage
Before you can compare your churn to any benchmark, you need to confirm you're counting the same thing the benchmark counts. Most founders aren't. The word "churn" gets collapsed into one bucket when it actually covers four distinct metrics.
Logo churn measures customers lost in a period divided by customers at the start of that period. It tells you how many accounts are leaving. Gross revenue churn measures MRR lost from cancellations and downgrades divided by starting MRR. It tells you the revenue loss before any expansion offsets it. Net Revenue Retention is the one everyone wants: starting MRR plus expansion MRR minus contraction MRR minus churned MRR, all divided by starting MRR. It can go above 100% when expansion outpaces losses. That's the SaaS dream state.
Here's the concrete illustration. A company can report roughly 6% logo churn and roughly 2% net revenue churn in the same month. Below $50K MRR, watch gross logo churn and gross revenue churn monthly. NRR is premature at that stage. Once a meaningful upsell or expansion motion exists, layer in net revenue churn and NRR.
Measurement hygiene matters more than most founders admit. Involuntary churn, meaning failed payments, must be separated from voluntary cancellations before any retention work begins. They require entirely different interventions.
Why early-stage churn is structurally elevated even when execution is sound
Much of the churn early-stage companies experience isn't poor execution. It's a predictable consequence when you operate before product-market fit is established. Founders who treat it as a crisis rather than a diagnostic signal waste resources on the wrong fixes.
Pre-PMF is the structural driver. Companies that haven't established product-market fit experience churn at a rate many multiples higher than established SaaS businesses. Early adopters who signed up for one value proposition find themselves using a different one. That's not a retention failure. That's the natural churn of a product still finding its shape. The product ships misaligned with actual user need, and churn is the first symptom.
Involuntary churn is a silent tax that inflates the headline number. A meaningful share of total churn across SaaS companies comes from failed payments rather than deliberate cancellations. But it sits inside the same churn number as voluntary cancellations, which makes the metric look worse than the execution actually is.
Team dysfunction lands directly in the product too. Delayed product decisions mean delayed onboarding fixes, which keeps churn elevated. Unclear roles, unresolved equity questions, and mismatched vision produce slow iteration cycles that compound the pre-PMF churn problem.
Diagnosing which cause is driving your churn: a segmentation approach
The right diagnostic question isn't "what is our churn rate." It's "where in the customer lifecycle is churn clustering, and what does that pattern implicate." The answer determines which lever to pull first. Four cues point in different directions.
If cancellations cluster in the first 30 to 90 days, the problem is onboarding and fit. If revenue loss spikes without more logo cancellations, the culprit is downgrades, seat reductions, discounts, or account concentration. Review MRR movement and affected contracts rather than customer count. If NRR improves while logo retention falls, expansion from growing accounts is masking losses in a deteriorating segment. Look at gross retention and account counts separately to find which cohort is leaving.
Cohort analysis makes these patterns visible. Cohorts acquired through different channels or with different messaging will show different retention shapes. That points to fit problems at acquisition rather than product problems after signup.
Segment by customer type before acting. A B2B SaaS serving both SMBs and mid-market accounts in the same product will show blended churn that obscures which segment is healthy and which is failing. The Lighter Capital 2025 B2B SaaS benchmarks, drawn from connected business data across 155 private startups, note that top performers who saw customer churn rise while revenue churn fell were likely refining their target customer segment. That's deliberate narrowing that looks like churn in the short term. Launch targeting matters permanently too. A badly targeted launch attracts wrong-fit users who churn within 90 days, and those cohorts don't recover. Curiosity-driven users churn at a structurally different rate than need-driven users.
Onboarding as the highest-leverage early intervention
Because most early-stage SaaS churn concentrates in the first 90 days, improving onboarding produces faster churn reduction than any other single intervention available to a pre-PMF company. The product may be capable. The activation sequence just fails to demonstrate it.
The numbers back this up. More than half will leave if they don't understand how to use the product. That's a fixable problem, not a product failure.
The Weave case shows what this looks like in practice. Weave reduced monthly customer churn from roughly 4% to roughly 0.5% when it added a structured implementation motion to the post-sale process. The company scaled from $8M to roughly $118M ARR through IPO. The intervention was operational, not a product rebuild.
Dedicated customer success staffing is the structural version of this fix. The largest churn improvement in the stage benchmarks coincides with companies hiring customer success managers rather than relying on founders or account executives to manage retention. For very early-stage companies that can't hire a CS team yet, the founder running structured onboarding calls is the equivalent lever. If they are, more features won't help.
The involuntary churn fix: recovering revenue that isn't actually gone
A meaningful share of total SaaS churn is failed payments, not deliberate cancellation. Fixing it requires no product change. That makes it the fastest win you can get once you've separated voluntary from involuntary losses.
Expired credit cards are the largest single cause of payment failure. They're addressable through automated card updater services before the card expires. Technical processing errors have the highest recovery rate of any failure type, because most of those customers intended to pay.
The sequencing point is simple. It improves the headline churn number, but it doesn't touch the harder voluntary problem. That clarifies the remaining signal so you can see what actually needs fixing.
Pricing model and contract structure as retention decisions made at signup
Churn is partly an outcome of decisions made before the customer signs up. Pricing model and contract length structurally determine how easy it is to leave, independent of product quality or onboarding quality. Annual contracts carry materially lower churn than month-to-month plans. These are structural decisions baked in before a single customer churns.
The practical question is whether your current pricing model matches the customer's actual value experience. Sometimes the lever isn't better onboarding. It's a contract structure that matches how the customer actually uses the product.
Tracking churn improvement: why results lag action by months and how to stay accountable
Churn reduction isn't an event. It's a process that typically takes several months before you see measurable results. The reason is structural. A founder who improves onboarding in Month 1 won't see the benefit in Month 1 churn. Those customers were already disengaged before the change. The improvement shows in the cohort that experienced the new onboarding, which takes several months to close out their first billing cycles.
That doesn't mean you skip weekly measurement. Weekly review of leading indicators catches deterioration before it compounds into churn. Activation rate, feature adoption, support tickets at onboarding, payment failure rates. Churn is a lagging indicator. The leading indicators that predict it are visible earlier and actionable sooner.
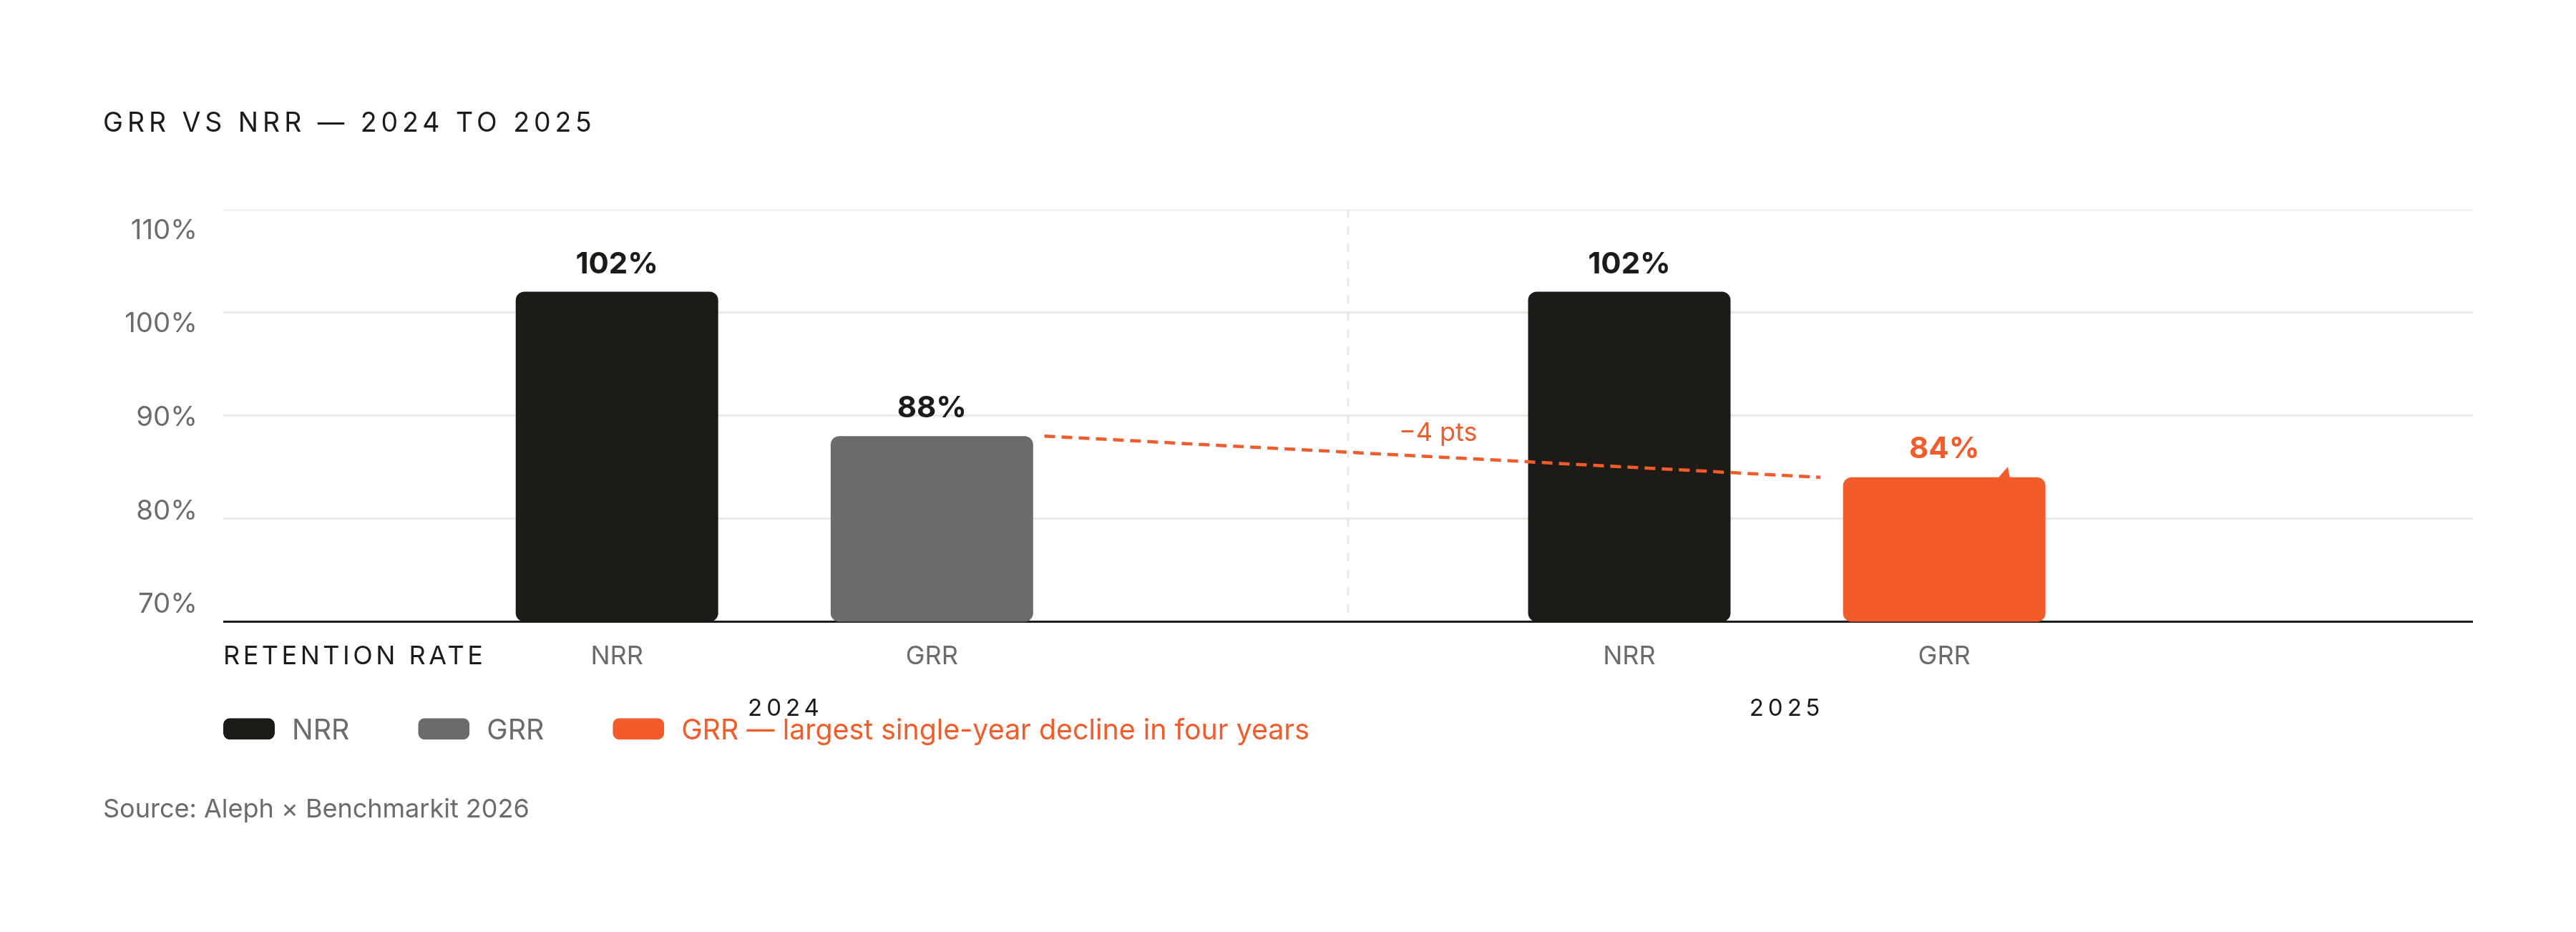
GRR belongs in that monitoring stack for a specific reason. Aleph × Benchmarkit 2026 data shows median GRR fell to 84% from 88% in the prior year, the largest single-year decline in four years. NRR held at 102%. A founder who only watches NRR would conclude everything is fine. A founder watching GRR would see the underlying deterioration early enough to act.
Goal-setting discipline keeps the whole thing honest. Set a specific monthly churn target for each 90-day period. Track the cohort-level retention curve for each acquisition month. Review the leading indicators weekly. Attribute changes in the curve to specific interventions so the team learns which levers work in their context. That last step is what separates companies that actually improve from companies that just measure.
The compounding cost of ignoring early churn: what happens if the rate holds
An early-stage monthly churn rate that feels manageable in isolation becomes an existential problem when compounded. A company at 6.5% monthly churn loses roughly half its customers over the course of a year. The hidden cost is the acquisition treadmill you need just to replace that volume and still grow the customer base. It breaks unit economics before the founder recognizes what's happening.
The acquisition math makes this worse. Sales and marketing dollars went significantly less far to generate SaaS revenue in 2025 compared to 2024, per Lighter Capital's 2025 B2B SaaS benchmarks. When acquisition efficiency falls and churn holds steady, the math breaks faster. You need more spend to replace the same volume of lost customers, and every dollar buys less than it did before.
The investor lens tells the same story. Most early-stage companies fall short of the 100% NRR baseline. A founder walking into a seed or Series A pitch with NRR well below 100% is telling investors the business requires constant acquisition to stand still. That's a materially harder fundraising conversation than one where retention is improving quarter over quarter.
The path forward is the argument this piece has built. Measure the right metric for your stage. Compare against the right benchmark. Identify which structural cause is driving the rate. Fix involuntary churn first, because it's the fastest win. Then onboarding, because it's the highest-leverage fix. Then revisit pricing model and contract structure. Track leading indicators weekly and measure cohort improvement over months. The founders who reduce churn aren't the ones who find a single fix. They diagnose accurately, act in the right sequence, and keep measuring long enough to see the cohort curves move. You now have the tools to run that process.