Customer Lifetime Value Calculation for Early-Stage SaaS Startups
Use margin-adjusted LTV and fully loaded CAC before trusting the ratio.

LTV tells a founder what a customer is worth over the life of the relationship. That part never changes. What changes is which formula to trust and how much weight to put on the number it spits out, depending on how many customers a company actually has. Use the wrong version at the wrong stage, and the math lies to you politely, right up until the bank account disagrees.
Early on, keep it dumb simple: LTV equals ARPA divided by churn rate.
ARPA is average revenue per account. Take total MRR, divide by total active customers. $50,000 in MRR across 500 customers gets you $100 a month per customer. Churn rate is the customers who canceled divided by the customers who started the period, times 100. Flipping that churn number upside down (1 divided by churn rate) gives you average customer lifetime. A 4% monthly churn rate implies a customer sticks around for roughly 25 months.
This formula measures revenue, not profit. It says nothing about margin, support costs, or server bills, and it was never built to. Think of it as a compass. That's exactly the right amount of precision for a company with fewer than 100 customers, one pricing tier, and pricing that hasn't moved around much. A spreadsheet updated quarterly beats any analytics platform at this stage, and buying churn-prediction software with 40 customers introduces complexity that a simple spreadsheet handles more than adequately.
The real weakness sits in the input. Churn rate is a guess when there's only a few months of data behind it, because early customers haven't had time to leave yet, so the number looks great by accident, not by design. A founder with six months of history who projects multi-year LTV off it is reading tea leaves. Track cohort LTV by signup month for a full 12 months before projecting anything. If a projection can't wait that long, apply a conservative haircut and move on. Everything downstream depends on this churn number being roughly right, so get that right before touching anything else.
Why gross margin must enter the formula before founders use LTV to make spending decisions
Once there's real usage data and pricing has settled down, revenue-based LTV turns dangerous, because it stops reflecting reality. The upgrade: LTV equals ARPA times gross margin percentage, divided by monthly churn rate.
Gross margin accounts for what it actually costs to serve that customer: server bills, support tickets, onboarding, implementation. Skipping it meaningfully inflates the real number. A customer generating significant lifetime revenue is worth materially less to the business once margin is applied. The rest went to cloud hosting and the support rep fielding password reset requests.
Spend against the inflated number and the ratio looks great on a slide deck while the bank balance quietly disagrees. Believe the bank statement, every time. It's the one number in this whole exercise that doesn't care about your assumptions.
CAC needs the same honesty. Fully loaded CAC includes sales salaries, commissions, SDR costs, marketing headcount, tools, events, and agency fees. B2B SaaS companies running inside sales teams often carry substantial sales compensation costs, so leaving comp out of CAC isn't a rounding error, it's a different number entirely, one that happens to make the founder look better than reality allows.
Pair both with CAC Payback Period: CAC divided by (ARPU times gross margin), which tells a founder how many months it takes to earn back what was spent acquiring that customer. Once margin-adjusted LTV and fully loaded CAC exist side by side, the LTV:CAC ratio finally means something. Before that, it's a vanity metric wearing a finance costume.
What LTV:CAC ratios look like at each funding stage, and what investors now demand
The famous 3:1 rule was built around mature SaaS companies operating at steady state. It was never meant to describe an early-stage company still figuring out who its customers are. That nuance got lost somewhere along the way, and 3:1 turned into the number every founder recites like a magic spell. Treat it as a floor, not a target, because top-quartile companies routinely clear it by a wide margin.
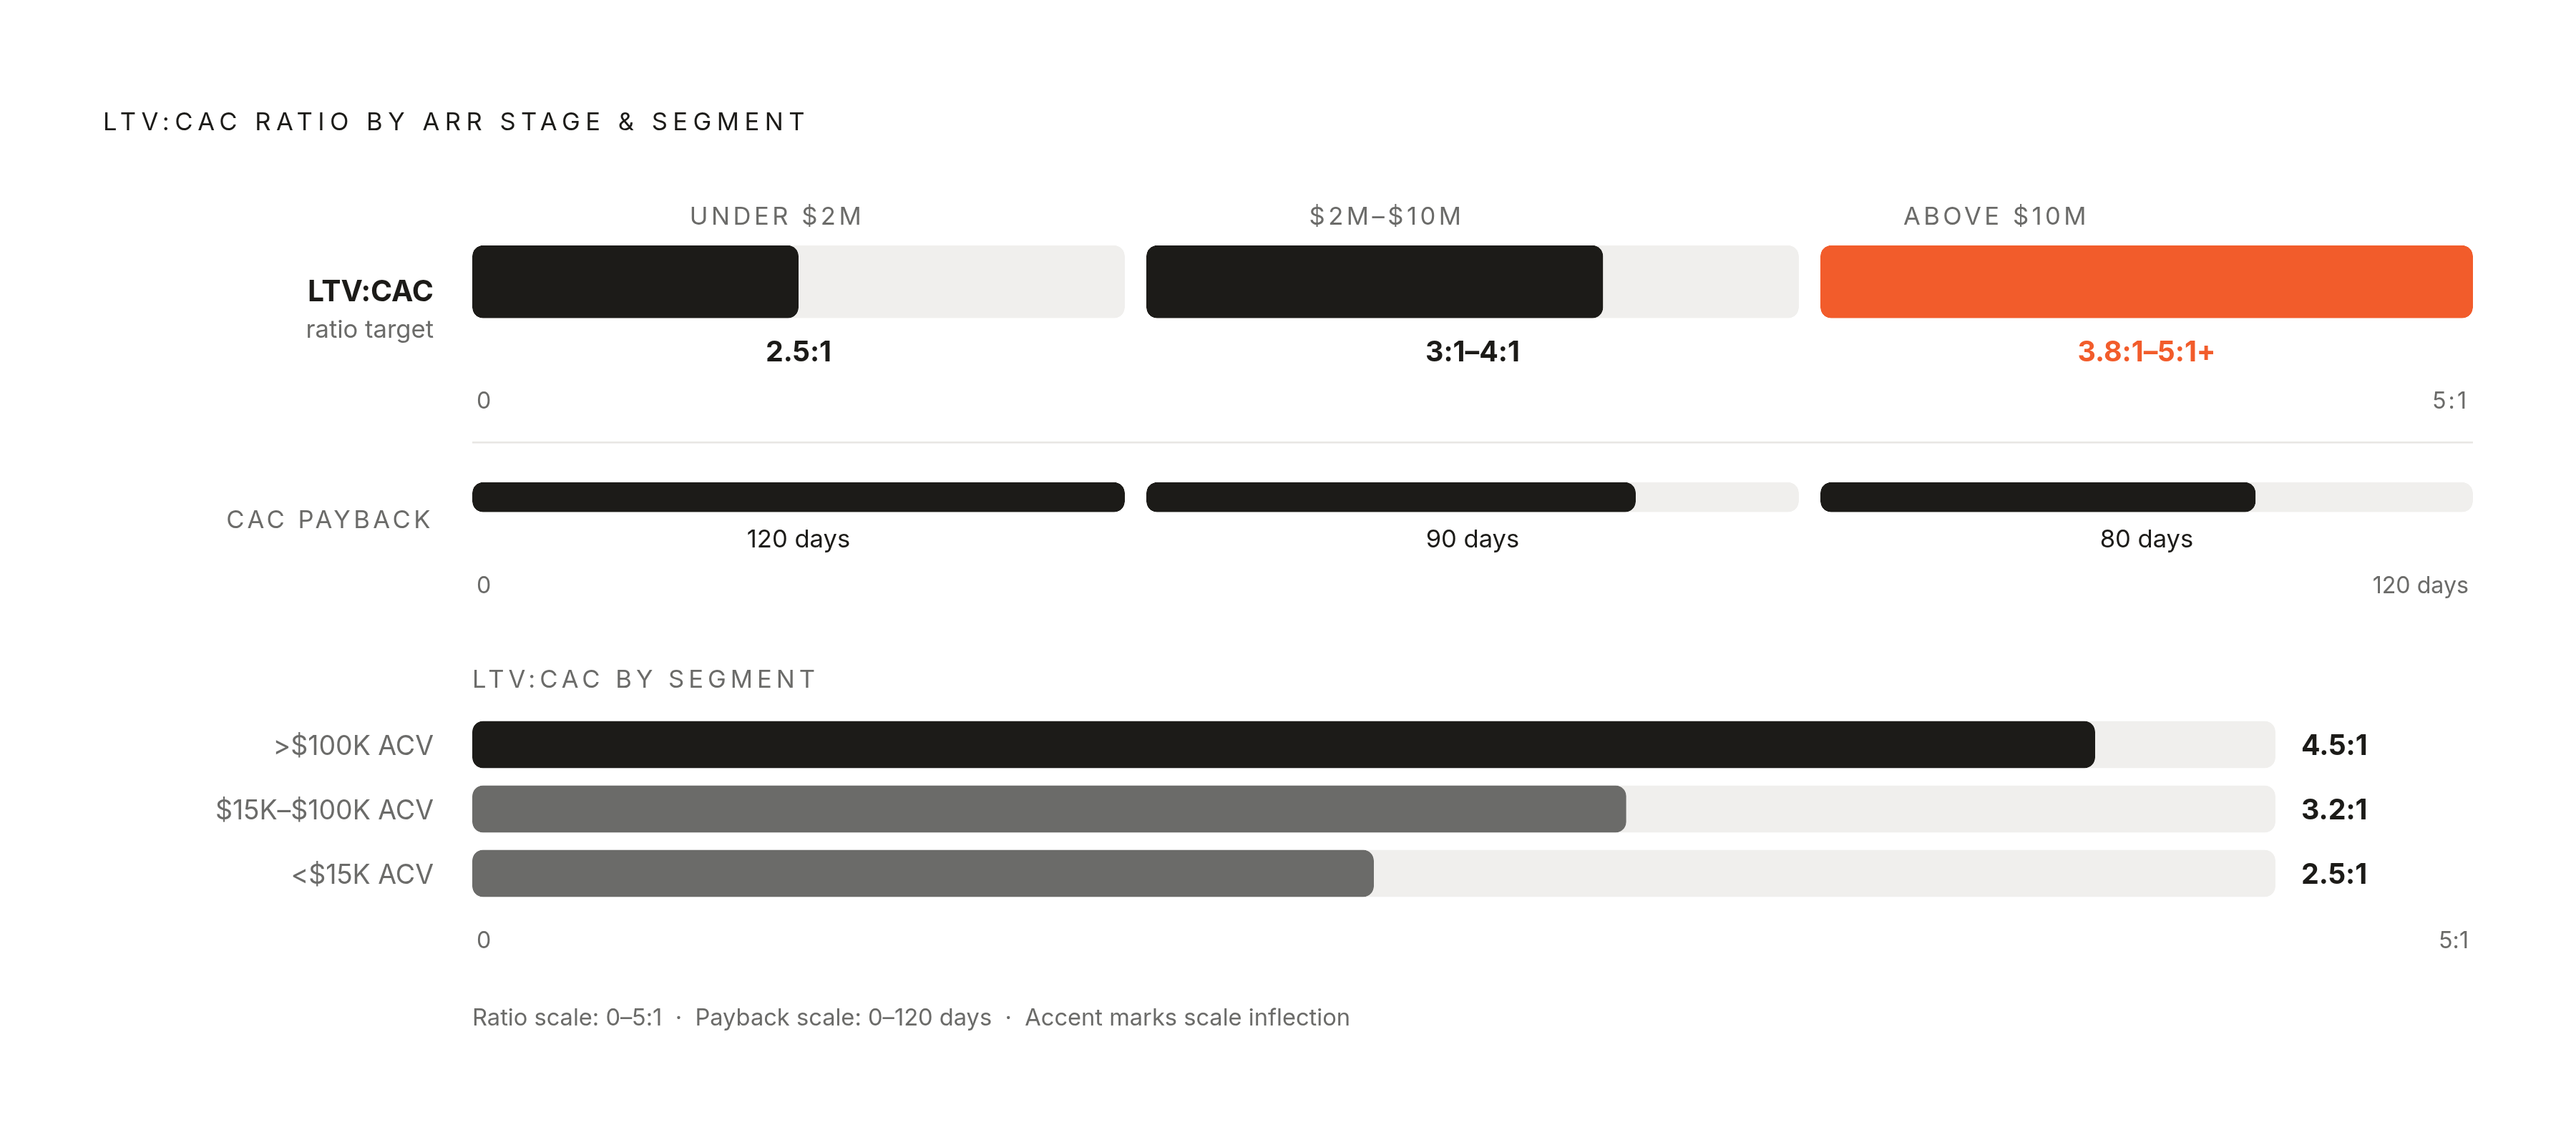
The benchmarks shift by stage, and pretending otherwise is where founders get themselves in trouble. Under $2M in ARR, average LTV:CAC runs around 2.5:1 with a 120-day payback, and that's expected rather than alarming, since heavy upfront investment is just what early-stage looks like. Between $2M and $10M in ARR, the target moves to 3:1 to 4:1 with a 90-day payback. Above $10M in ARR, the range climbs to 3.8:1 up to 5:1 or higher, with an 80-day payback.
Segment matters just as much as stage. Enterprise SaaS (deals above $100K in annual contract value) runs around 4.5:1. Mid-market ($15K to $100K ACV) sits closer to 3.2:1. SMB (under $15K ACV) runs around 2.5:1. Retention swings either number hard: cut retention in half and the LTV number follows it down the same day.
Investors have gotten sharper about all of this, and the founders who haven't caught up are the ones getting the toughest questions in the room. Efficiency metrics appear in the overwhelming majority of Series A and B term sheets, and investors at that stage want 4:1 or better, broken out by cohort rather than smoothed into a blended average. A 2.5:1 ratio at seed is the expected starting line. But a founder walking into a raise needs to know exactly where the business sits on that curve and show, with real cohort numbers, how it gets to 3:1 and beyond.
Churn is the single variable that moves LTV more than anything else a founder controls
Churn sits in the denominator of both formulas above, so a small move there produces an outsized swing in LTV. Cutting churn from 2% down to 1.5% makes LTV jump 33%. No extra ad spend required, no new sales hire, just fewer people walking out the door.
Split churn into two buckets, voluntary and involuntary, because they get solved by completely different teams. Involuntary churn, the failed payments and expired cards sitting in a drawer somewhere, isn't a signal about product quality. Dunning systems (automated retry logic, update-your-card emails) recover a meaningful chunk of it. Fixing this is closer to plumbing than strategy, and it's the easiest win available to a founder who wants to move the number this month rather than next year.
Net Revenue Retention amplifies the picture further. Elite SaaS companies see existing customers spend more over time instead of merely sticking around, and usage-based pricing tends to outperform flat subscription pricing on this exact measure, without touching acquisition cost. Nobody puts this on a pitch deck slide, but it's doing more work than the logo wall.
Enterprise expansion revenue complicates the math in its own way. A pilot deal that starts at $5,000 and grows into a $200,000 contract makes early LTV projections look almost useless in hindsight. Expansion cohorts need their own tracking window, 18 months or more, before anyone treats the growth pattern as reliable rather than lucky. Retention is where enterprise value actually gets built, full stop. Everything else in this article is commentary on that one fact.
Why blended LTV hides the information founders need to make decisions
A single blended LTV number can look perfectly healthy while hiding two or three different businesses living inside the same product. An enterprise customer can be worth dramatically more than an SMB customer inside the same platform, and a blended average smears that gap into invisibility, which is exactly the problem: the number that's supposed to guide spending decisions ends up describing nobody.
Segment along three lines from day one, and do it before the temptation to average everything together sets in: customer size (SMB, mid-market, enterprise), acquisition channel (organic search, paid ads, referral), and pricing tier. Referral customers tend to run cheap to acquire and stick around longer too. Customers on higher-priced tiers usually carry more switching costs, which naturally lowers their churn without anyone lifting a finger.
None of this needs acting on immediately. Segmentation only means something once each slice has enough customers in it to say something statistically real rather than anecdotally interesting. Below that threshold, track the dimensions quietly and resist drawing a conclusion from a sample size of eleven, because eleven customers can tell a founder anything they want to hear.
The segment showing the highest LTV and lowest churn is usually pointing straight at where product-market fit actually lives. That's the group the product solves a real problem for. The economics are just confirming what the product experience already suggests, and founders who chase the blended average instead of that segment end up optimizing for the wrong customer.
Distinguishing real product-market fit from flattering noise in LTV calculations
Early LTV numbers are estimates dressed up as measurements. A company projecting multi-year LTV off a handful of months of data is extrapolating, and that extrapolation rests on assumptions that can fall apart the moment more customers show up. Product-market fit and economic viability are two separate questions, and the second one usually doesn't get answered until 12 to 18 months after launch. A product people genuinely love can still bankrupt its founders if each customer costs more to acquire and serve than they ever pay back.
Watch for these signs together, because any one alone can be a coincidence: MRR growth that stalls the moment paid ad spend gets dialed back, 30-day retention below 30%, more than 60% of signups coming from paid channels, an NPS under 30, and, strangest of all, the best-retained users turning out to be the ones who got the product free rather than through the main growth channel. If three or more of these are visible at once, the churn hasn't hit yet, but the structural setup for it already has. It's a house built on a floodplain. No water yet, but check the elevation before betting the LTV model on next spring.
A quick gut check helps too. Ask users, after a week or two of use and with at least 40 responses, how they'd feel if the product disappeared tomorrow. If 40% or more say "very disappointed," the retention signal behind the LTV formula is more likely to hold. Growth rate offers a second cross-check: aim for 10 to 20% month-over-month MRR growth early on. A company growing at that pace, with churn holding steady or improving, has earned the right to trust its own LTV projection. A company growing at that pace with churn creeping up hasn't earned anything yet, it's just spending faster than the leak can drain it.
The practical progression of formulas and tools, and when to upgrade each
Matching the formula to the stage means resisting the urge to skip ahead just because a fancier tool exists.
Pre-product-market fit, under roughly 100 customers: use Simple CLV (ARPA divided by churn rate) in a spreadsheet, and put all the effort into nailing down baseline retention before optimizing anything else. Cohort variance runs too high for software to add real value here. Month-over-month swings above 40% aren't unusual for pre-PMF startups, so a dashboard built this month is stale by next month anyway.
Post-PMF, approaching $2M in ARR: switch to gross-margin-adjusted LTV, bring in fully loaded CAC, and start tracking CAC payback period properly. Segment by at least one dimension, channel or company size, because a blended average conceals the real story it's built from.
Growth-stage, between $2M and $10M in ARR: automated attribution by channel starts earning its keep. Tools like Amplitude or Mixpanel become worth the spend once manual LTV calculations eat up more than roughly 20 hours a month. Before that point, paying for the software just means paying to automate a problem a spreadsheet was already handling fine, which is the SaaS equivalent of hiring a chauffeur to drive you across the parking lot.