Customer Acquisition Cost Calculation for Startups
Most founders confuse what belongs in the formula, hiding the channels where money actually leaks.

What goes into the formula, and what doesn't
CAC stands for customer acquisition cost. The formula takes five seconds: total sales and marketing spend, divided by new paying customers in a given window. What trips founders up is everything that number depends on, what counts, what doesn't, and what it actually tells you once you've got it. It's everything that number depends on, what counts, what doesn't, and what it actually tells you once you've got it.
Investors gate funding on this number now, so treat it like a vital sign. A CAC that climbs faster than lifetime value is a slow leak in the bucket. It's a slow leak in the bucket, and no amount of top-line revenue growth patches a hole like that. If the number keeps rising no matter how much the funnel gets tuned, the product probably isn't landing the way the team thinks it is.
The numerator should include paid ads across Google, Meta, and LinkedIn, sales salaries and commissions, the CRM and automation tools sitting under the marketing team, design and copywriting and video production, agency fees tied to lead generation, event costs, and a fair slice of overhead for the admin work that supports acquisition. Support costs, infrastructure, and R&D don't belong. Those keep a customer happy after the sale. They didn't get the customer in the door, and folding them in muddies a number built to answer one specific question.
The most common mistake treats CAC as just ad spend. Divide $18,000 in Google and Meta spend by 200 customers and the CAC looks great. That math is wrong, and it's wrong in a specific way: it skips the sales rep who closed half those deals, the CRM license, the freelancer who wrote the landing page copy. Founders lose track of onboarding time, training costs, and money spent on campaigns that flopped. All of it belongs in the number. None of it disappears just because it's annoying to track down.
Timing catches people just as often. Spend in Q1 can close deals in Q2, so match the window on both sides of the fraction, or build in a lag adjustment when the sales cycle runs long. Skipping that step makes the comparison apples against a fruit that hasn't grown yet.
Blended CAC vs. fully loaded CAC
Blended CAC takes total marketing and sales spend across every channel and divides it by every new customer, full stop. Fast, simple, fine for a board slide. Wrong for almost everything else, and here's the actual problem with it: blended CAC hides exactly where the money's leaking.
Benchmarkit's 2025 data shows blended CAC has climbed 10% since 2022. As that floor keeps rising, channel-level waste gets easier to bury inside an average that still looks fine on paper. Fully loaded CAC fixes that. Folding in salaries, tools, and overhead, everything operational tied to acquisition, makes the number honest fast. That's the version that belongs in unit-economics conversations with investors who read past the summary slide.
In practice, that honesty looks like a fully loaded CAC around $1,800, an ARPU near $150, and an 80% gross margin stretching payback to roughly 15 months. Swapping in the blended number instead makes the story look a lot rosier, right up until cash gets tight.
Run a third cut too: organic CAC against paid CAC. Organic (SEO, content, email, referrals) takes longer to pay off but compounds. Paid (search ads, social ads, display) moves fast and dies the second the budget does. Segment by channel, by customer type (SMB versus enterprise), and by motion (self-serve versus sales-assisted), and the picture of which channels actually earn their keep sharpens fast.
Run blended for the board deck, fully loaded for internal decisions, and paid-versus-organic broken out by channel for budget calls. None of this holds up if ads, CRM, and billing don't share a customer ID. Missing that link inflates paid CAC with closed-won deals nobody ever traced back to their source.
A worked CAC calculation from start to finish
Take a hypothetical Q1 2026 SaaS startup. Paid ads across Google, Meta, and LinkedIn run $18,000. Sales salaries and commissions add $24,000. Marketing tools and CRM software come to $3,200. Content and creative production adds $4,800. Total spend: $50,000.
New customers acquired that quarter: 200. CAC comes out to $50,000 divided by 200, or $250 per customer.
That $250 means nothing by itself, and that's where founders trip up most. A $250 CAC next to an LTV over $1,000 makes the business look healthy and scalable. The same $250 CAC next to an LTV of $300 is a warning light on the dashboard. Same formula, same output, completely different diagnosis depending on what sits on the other side of the ledger.
Payback period adds a second lens: CAC divided by monthly profit per customer. A $100 CAC against $80 in monthly profit gives a payback period of 1.25 months, fast by any measure. Stacked next to the $250 example above, margin and revenue per customer are doing all the work of changing the read on an otherwise identical formula.
Once the aggregate number is in hand, re-run it by channel, by segment, by motion. That blended $250 might be hiding a cheap CAC from referrals sitting right next to a brutal one from cold outbound. The aggregate tells you where you stand. The breakdown tells you where the money's actually working.
What CAC benchmarks look like across industries and customer segments
SimplicityDX and Phoenix Strategy Group data show CAC has surged 222% over roughly eight years, with another 40 to 60% jump just between 2023 and 2025. Any benchmark table sits on a rising floor. Treat every number below as a snapshot.
First Page Sage breaks CAC out by industry, B2B against B2C: SaaS runs $273 B2B and $166 B2C. eCommerce runs $84 B2B and $68 B2C. Cybersecurity jumps to $429 B2B against just $73 B2C. Financial services hits $923 B2B versus $173 B2C. Legal costs $915 B2B and $457 B2C. Higher education tops the list at $1,424 for one buyer type against just $116 for the other, the widest gap on the entire table.
Within SaaS alone, customer segment swings the number hard. SMB SaaS runs $200 to $700. Mid-market SaaS runs $1,200 to $2,000. Enterprise SaaS above $100K ACV runs anywhere from $5,000 to $250,000 or more. CAC climbs more than tenfold moving from SMB to enterprise, mostly because enterprise deals drag in more stakeholders and longer sales cycles, and pretending the SMB playbook scales up to enterprise is how budgets get torched.
Consumer-facing categories run cheapest, with eCommerce bottoming out around $64 to $84. First Page Sage's data via Userpilot puts fintech enterprise at $14,772, the opposite end of that spectrum. First Page Sage's channel table also reflects a three-year average that bakes in a ramp period of several months. Chase someone else's number without accounting for that ramp, and the result is feeling behind for no real reason.
Acquisition channel choice and its effect on CAC
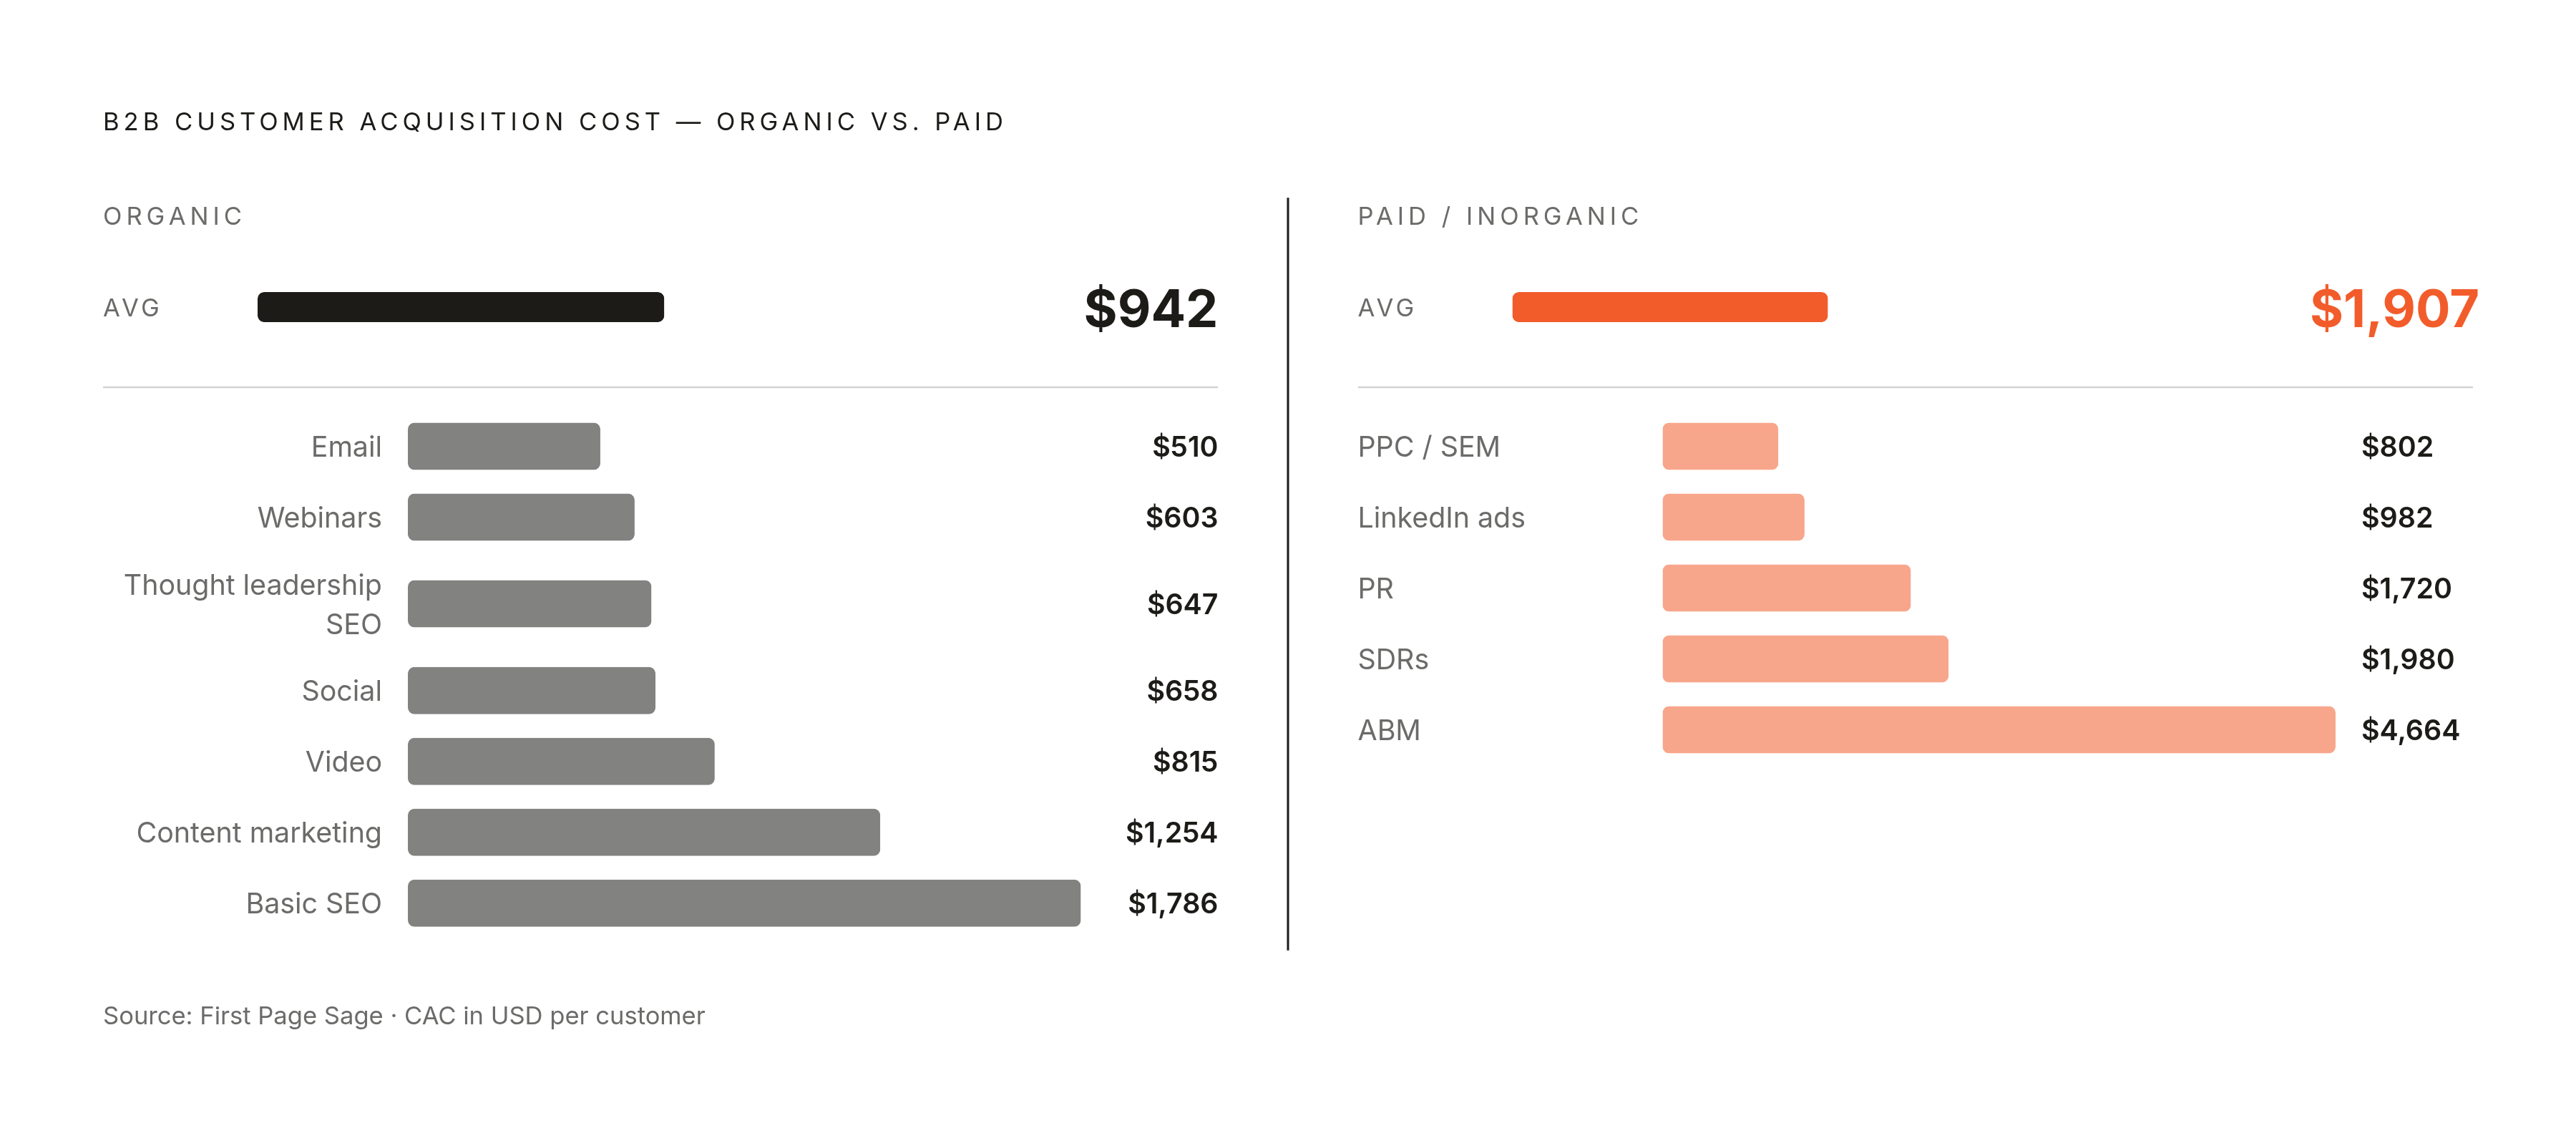
Channel choice sets the CAC ceiling before a single ad runs. First Page Sage's B2B data lays it out clean, and the gap between the two sides isn't small.
On the organic side: thought leadership SEO runs $647, email runs $510, social runs $658, content marketing runs $1,254, basic SEO runs $1,786, webinars run $603, video runs $815. Organic average: $942.
On the inorganic side: PPC/SEM runs $802, LinkedIn ads run $982, SDRs run $1,980, ABM runs $4,664, PR runs $1,720. Inorganic average: $1,907, roughly double the organic side.
Referrals sit apart from both lists and are widely regarded as among the lowest-CAC channels available. Most founders underrate the compounding value of referrals. Organic compounds slowly. Paid moves fast and stops dead the second the spend does. Companies that win long-term build both, then tilt the mix toward the cheaper, compounding side as the business matures.
Reporting discipline matters just as much as channel choice. Every channel needs to report closed customers, not MQLs, not raw leads. Handing a PPC agency a dashboard full of leads with no closed-won data attached artificially inflates paid CAC the second anyone tries to reconcile it.
For early-stage founders, starting with referrals and community-driven acquisition while the organic engine gets built is close to the cheapest path to first customers there is. Same instinct as doing things that don't scale early on: the tactics that feel small and manual right now are usually the ones with the lowest CAC on the whole board.
How product-led growth changes the CAC equation
Product-led growth swaps a demo-heavy, sales-driven motion for a free tier or trial that does the convincing on its own. No sales rep, no discovery call. The product has to show its own work, and either it does or the user leaves.
The payoff appears directly in CAC. Industry benchmarks show PLG companies acquire customers at roughly one-tenth the cost of sales-led peers, hundreds of dollars to low thousands versus thousands to tens of thousands. Payback shortens too, since self-serve activation strips out the sales overhead that normally sits inside a fully loaded CAC number.
There's a catch, and it's a big one. Across the industry, SaaS activation and onboarding completion rates consistently fall well below expectations. Read that straight: a large share of people who sign up never get far enough to see real value. That's the majority of the funnel gone. That leak appears nowhere as a line item on any spend report, so it inflates effective CAC while the budget stays untouched. Every user who churns before activation is a fully paid-for acquisition that never converted into anything.
Activation flows and onboarding belong in the MVP, not bolted on after launch as a phase-two nicety. Acquisition dollars get recovered in that first onboarding window or they get lost there, permanently, and no amount of downstream marketing polish fixes a flow that loses people in the first five minutes.
Price point decides between PLG and sales-led more than anything else. At SMB ranges, where SaaS CAC runs $200 to $700, PLG is almost always the more capital-efficient bet, and betting against it there is usually a mistake. At enterprise ACVs, where CAC can run anywhere from $5,000 to $250,000 or more, a hybrid or fully sales-led motion still makes sense, provided the LTV actually backs it up.
Reading your CAC against LTV and payback period
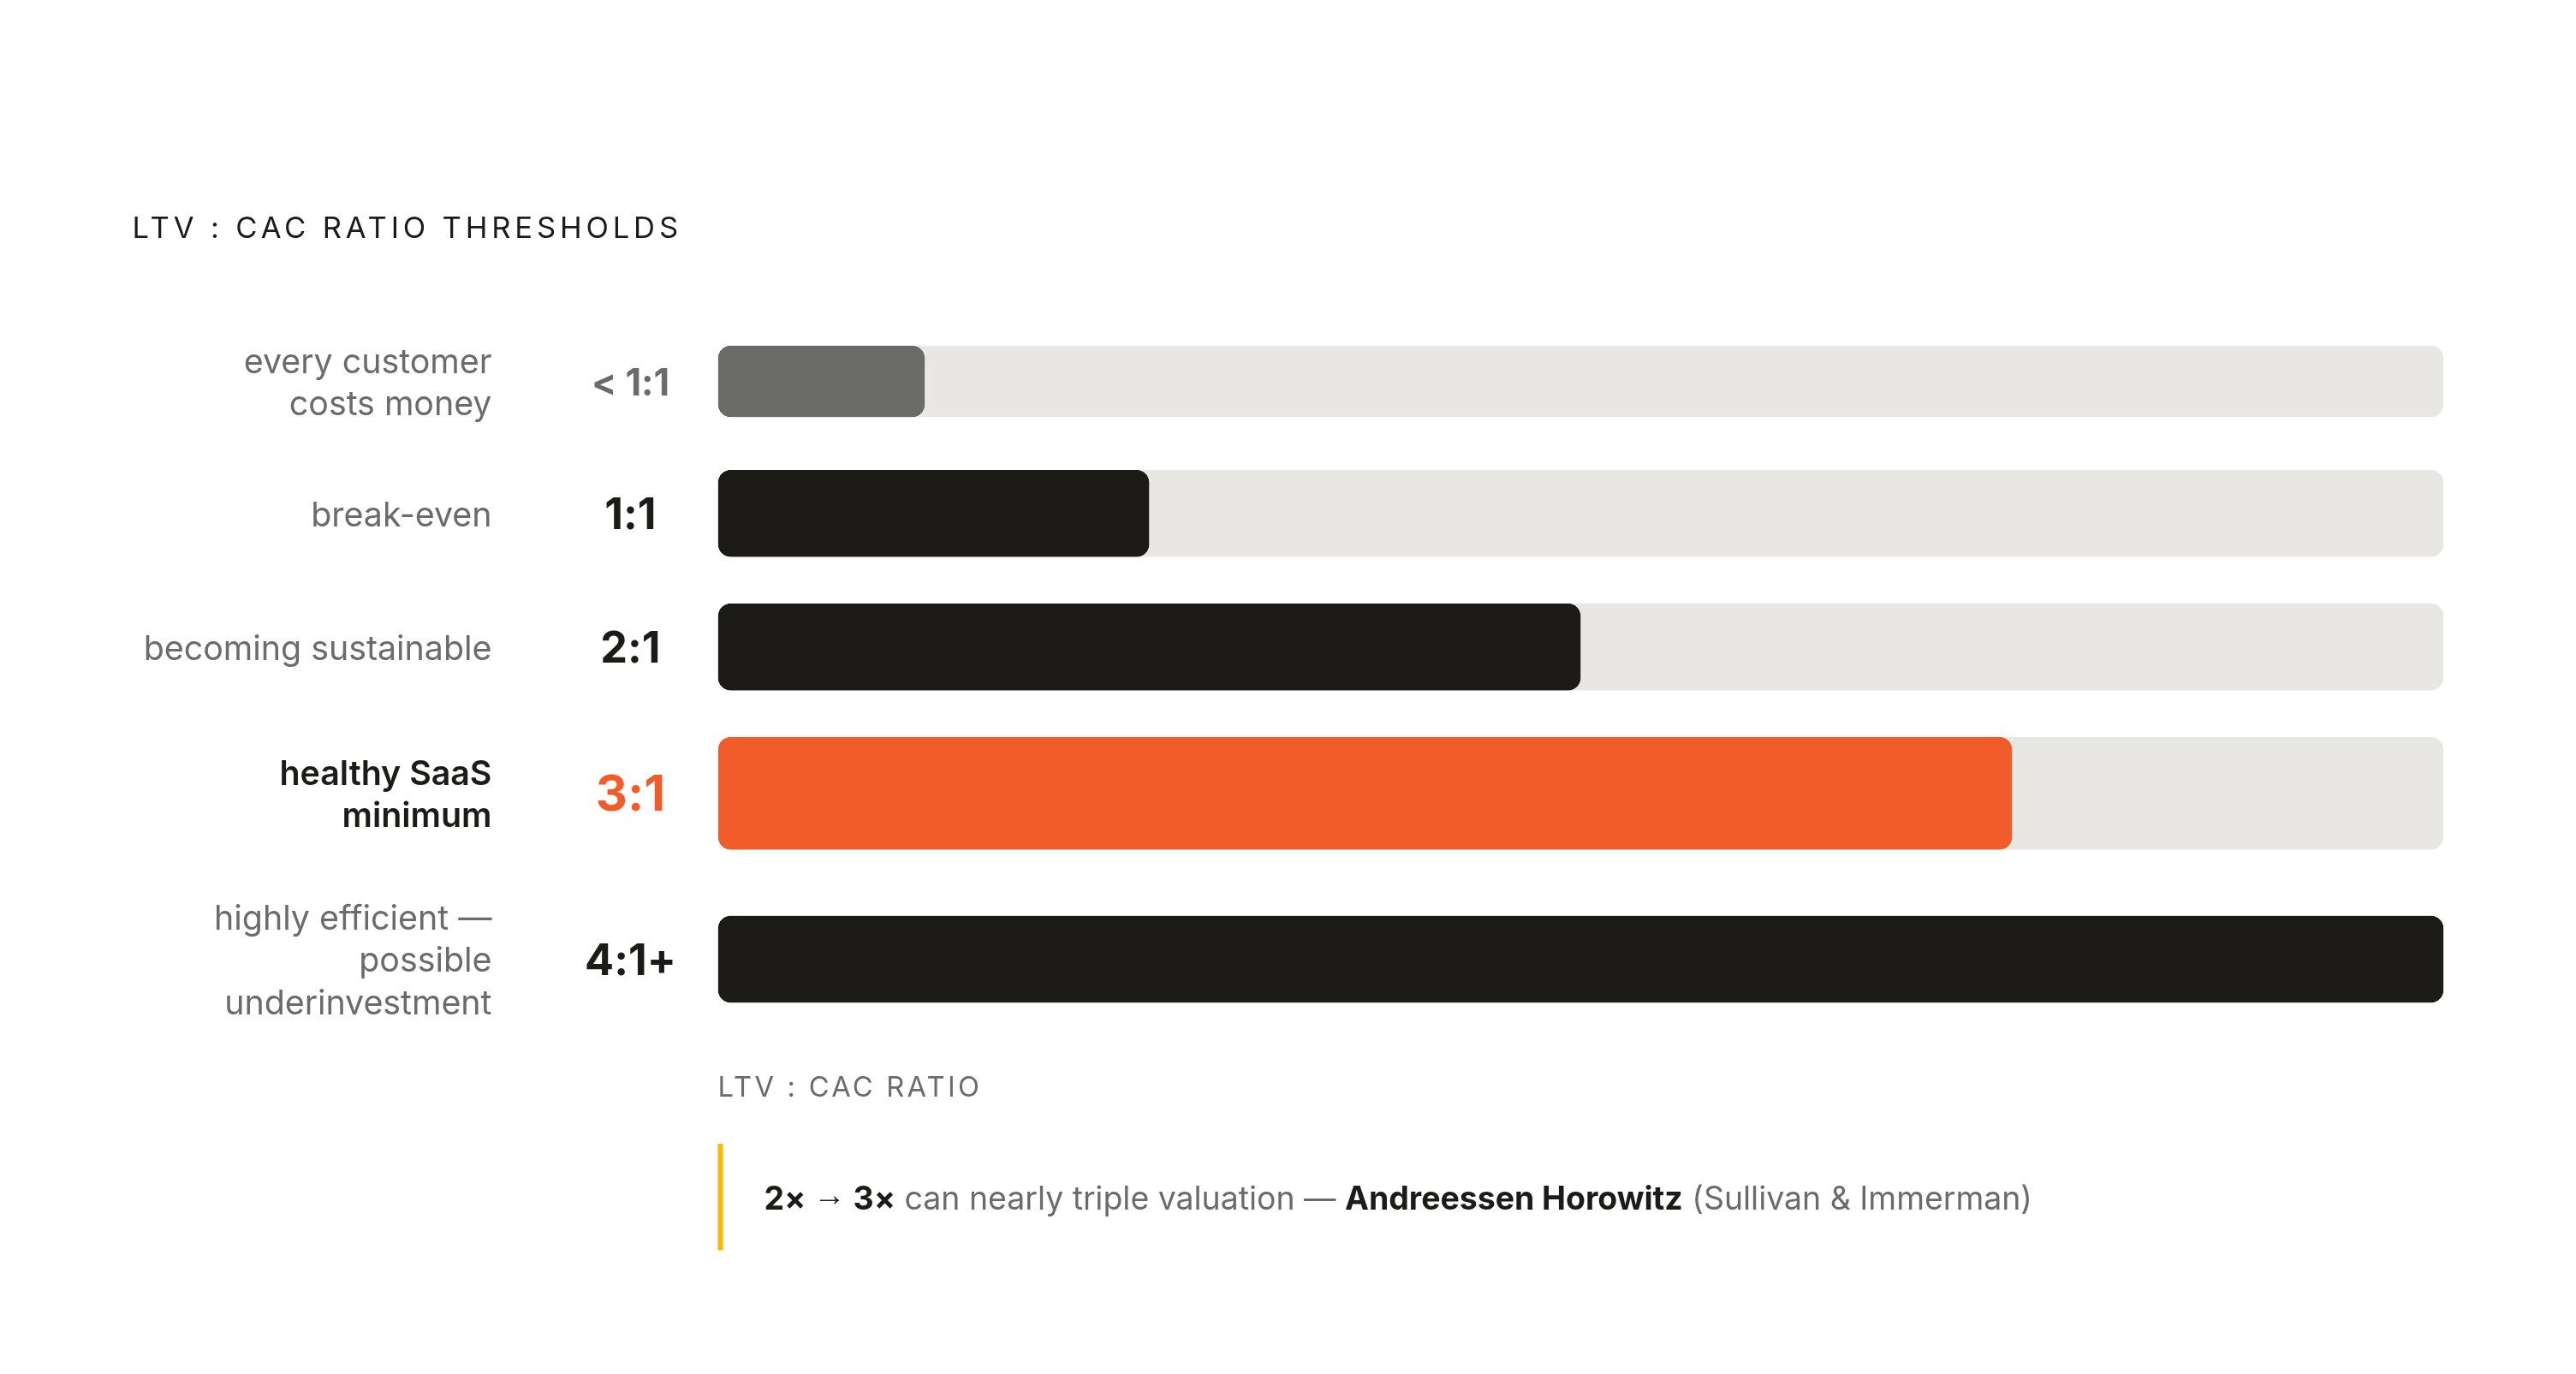
CAC alone is half a sentence. LTV:CAC is the long-run return test, and A healthy ratio is broadly benchmarked at 3:1: every dollar spent acquiring a customer should return three dollars over that customer's lifetime. Plenty of B2B SaaS companies push for 4:1 to 7:1 before calling the business genuinely profitable, and anything less gets treated as a work in progress.
Stripe lays out the thresholds cleanly. 1:1 is break-even. 2:1 is becoming sustainable. 3:1 is stable. 4:1 or higher is highly efficient, though it can also mean the company is underinvesting in growth rather than nailing efficiency. Below 1:1, every new customer costs money rather than making it, full stop. Andreessen Horowitz's Jamie Sullivan and Alex Immerman noted that moving from a 2x to a 3x ratio can nearly triple a company's valuation. That's why CAC belongs in strategy conversations with product and sales, not stuck inside an ads dashboard only the marketing team ever opens.
Payback period asks a different question: can the business survive long enough to collect on the investment it already made? Same formula as before, CAC divided by monthly profit per customer. Stripe's benchmark for healthy SaaS payback is 12 months or under, with the strongest performers landing between five and seven.
A company can post a strong 4:1 LTV:CAC ratio and still be starving for cash if payback stretches past two years. LTV:CAC says whether the math works out eventually. Payback says whether there's enough cash on hand to survive until profitability arrives. Both numbers can be true at once, and only one of them keeps the lights on.
By 2026, the median SaaS company spends roughly $2.00 to acquire $1 of new ARR, a figure that has risen approximately 14% from 2023. Hitting a 3:1 LTV:CAC ratio in that climate takes real discipline, not luck.
Go back to the earlier example: $250 CAC. Pairing that against an LTV of $1,000 produces a comfortable 4:1 ratio, well inside healthy territory. Pairing that same $250 against an LTV of $300 drops the ratio to barely above 1:1, a business quietly running in place while it looks busy doing so. The formula never changes. What changes is everything riding on the other side of it. CAC needs to be calculated properly instead of eyeballed off the ad spend line alone.