Customer Retention Rate Benchmarks by Startup Type
Different business models demand different retention targets, not one universal benchmark.

B2B SaaS averages around 90% annual retention. E-commerce is 28-40%. Streaming is in the middle, around 55-75%. None of those numbers are good or bad on their own. They're just what the business model produces, and the mistake almost everyone makes is grading their own company against the wrong one of these ranges.
Contract length decides more of your retention rate than your customer success team ever will. Purchase frequency and whether there's a contract to cancel also decide more of your retention rate. A 55% retention rate gets a B2B SaaS founder fired. That same number is roughly where hospitality sits by design, given the transactional nature of the category. Same digit, completely different story. Before anyone panics over a churn dashboard, the first move is figuring out which game they're actually playing.
B2B SaaS retention: what the numbers look like at different stages and segments
B2B SaaS tops every other business model at around 90% annual retention. That headline number is really two different businesses mashed into one average, and treating them as a single category is where most benchmarking goes wrong.
Enterprise SaaS runs monthly churn of about 0.5% to 1%. These are annual contracts, deeply embedded into daily workflows, with five people across three departments who'd need to sign off before anyone even considers switching vendors. Nobody cancels that on a whim. SMB and self-serve SaaS lives on the opposite end: 3% to 7% monthly churn, one-click cancellation, price-sensitive buyers, and onboarding that's often little more than a welcome email and a hope. Annual gross retention reflects that split cleanly. Enterprise vendors commonly hit 90 to 95%+ GRR, while self-serve SMB tools run 70 to 85%, and inside that range, 80 to 85% or above counts as genuinely good.
A broad multi-firm dataset puts the cross-firm average at 74%, while well-run enterprise vendors post 88 to 95%. That gap is a segment mix problem, not evidence anyone's underperforming. Comparing a self-serve tool to an enterprise benchmark tells you nothing except that you grabbed the wrong ruler.
Revenue retention is what investors actually study, and here the picture sharpens. The SaaS Capital survey put median net revenue retention (NRR) at 101% and gross revenue retention (GRR) at 91%. Bootstrapped companies in that same survey edged out their venture-backed peers, posting 104% NRR and 92% GRR, which says something: capital discipline and retention discipline travel together more often than people expect. If GRR drops below 85%, something's broken. Usually that break is product-market fit or customer success, rarely neither.
How NRR separates high-growth SaaS companies from the rest
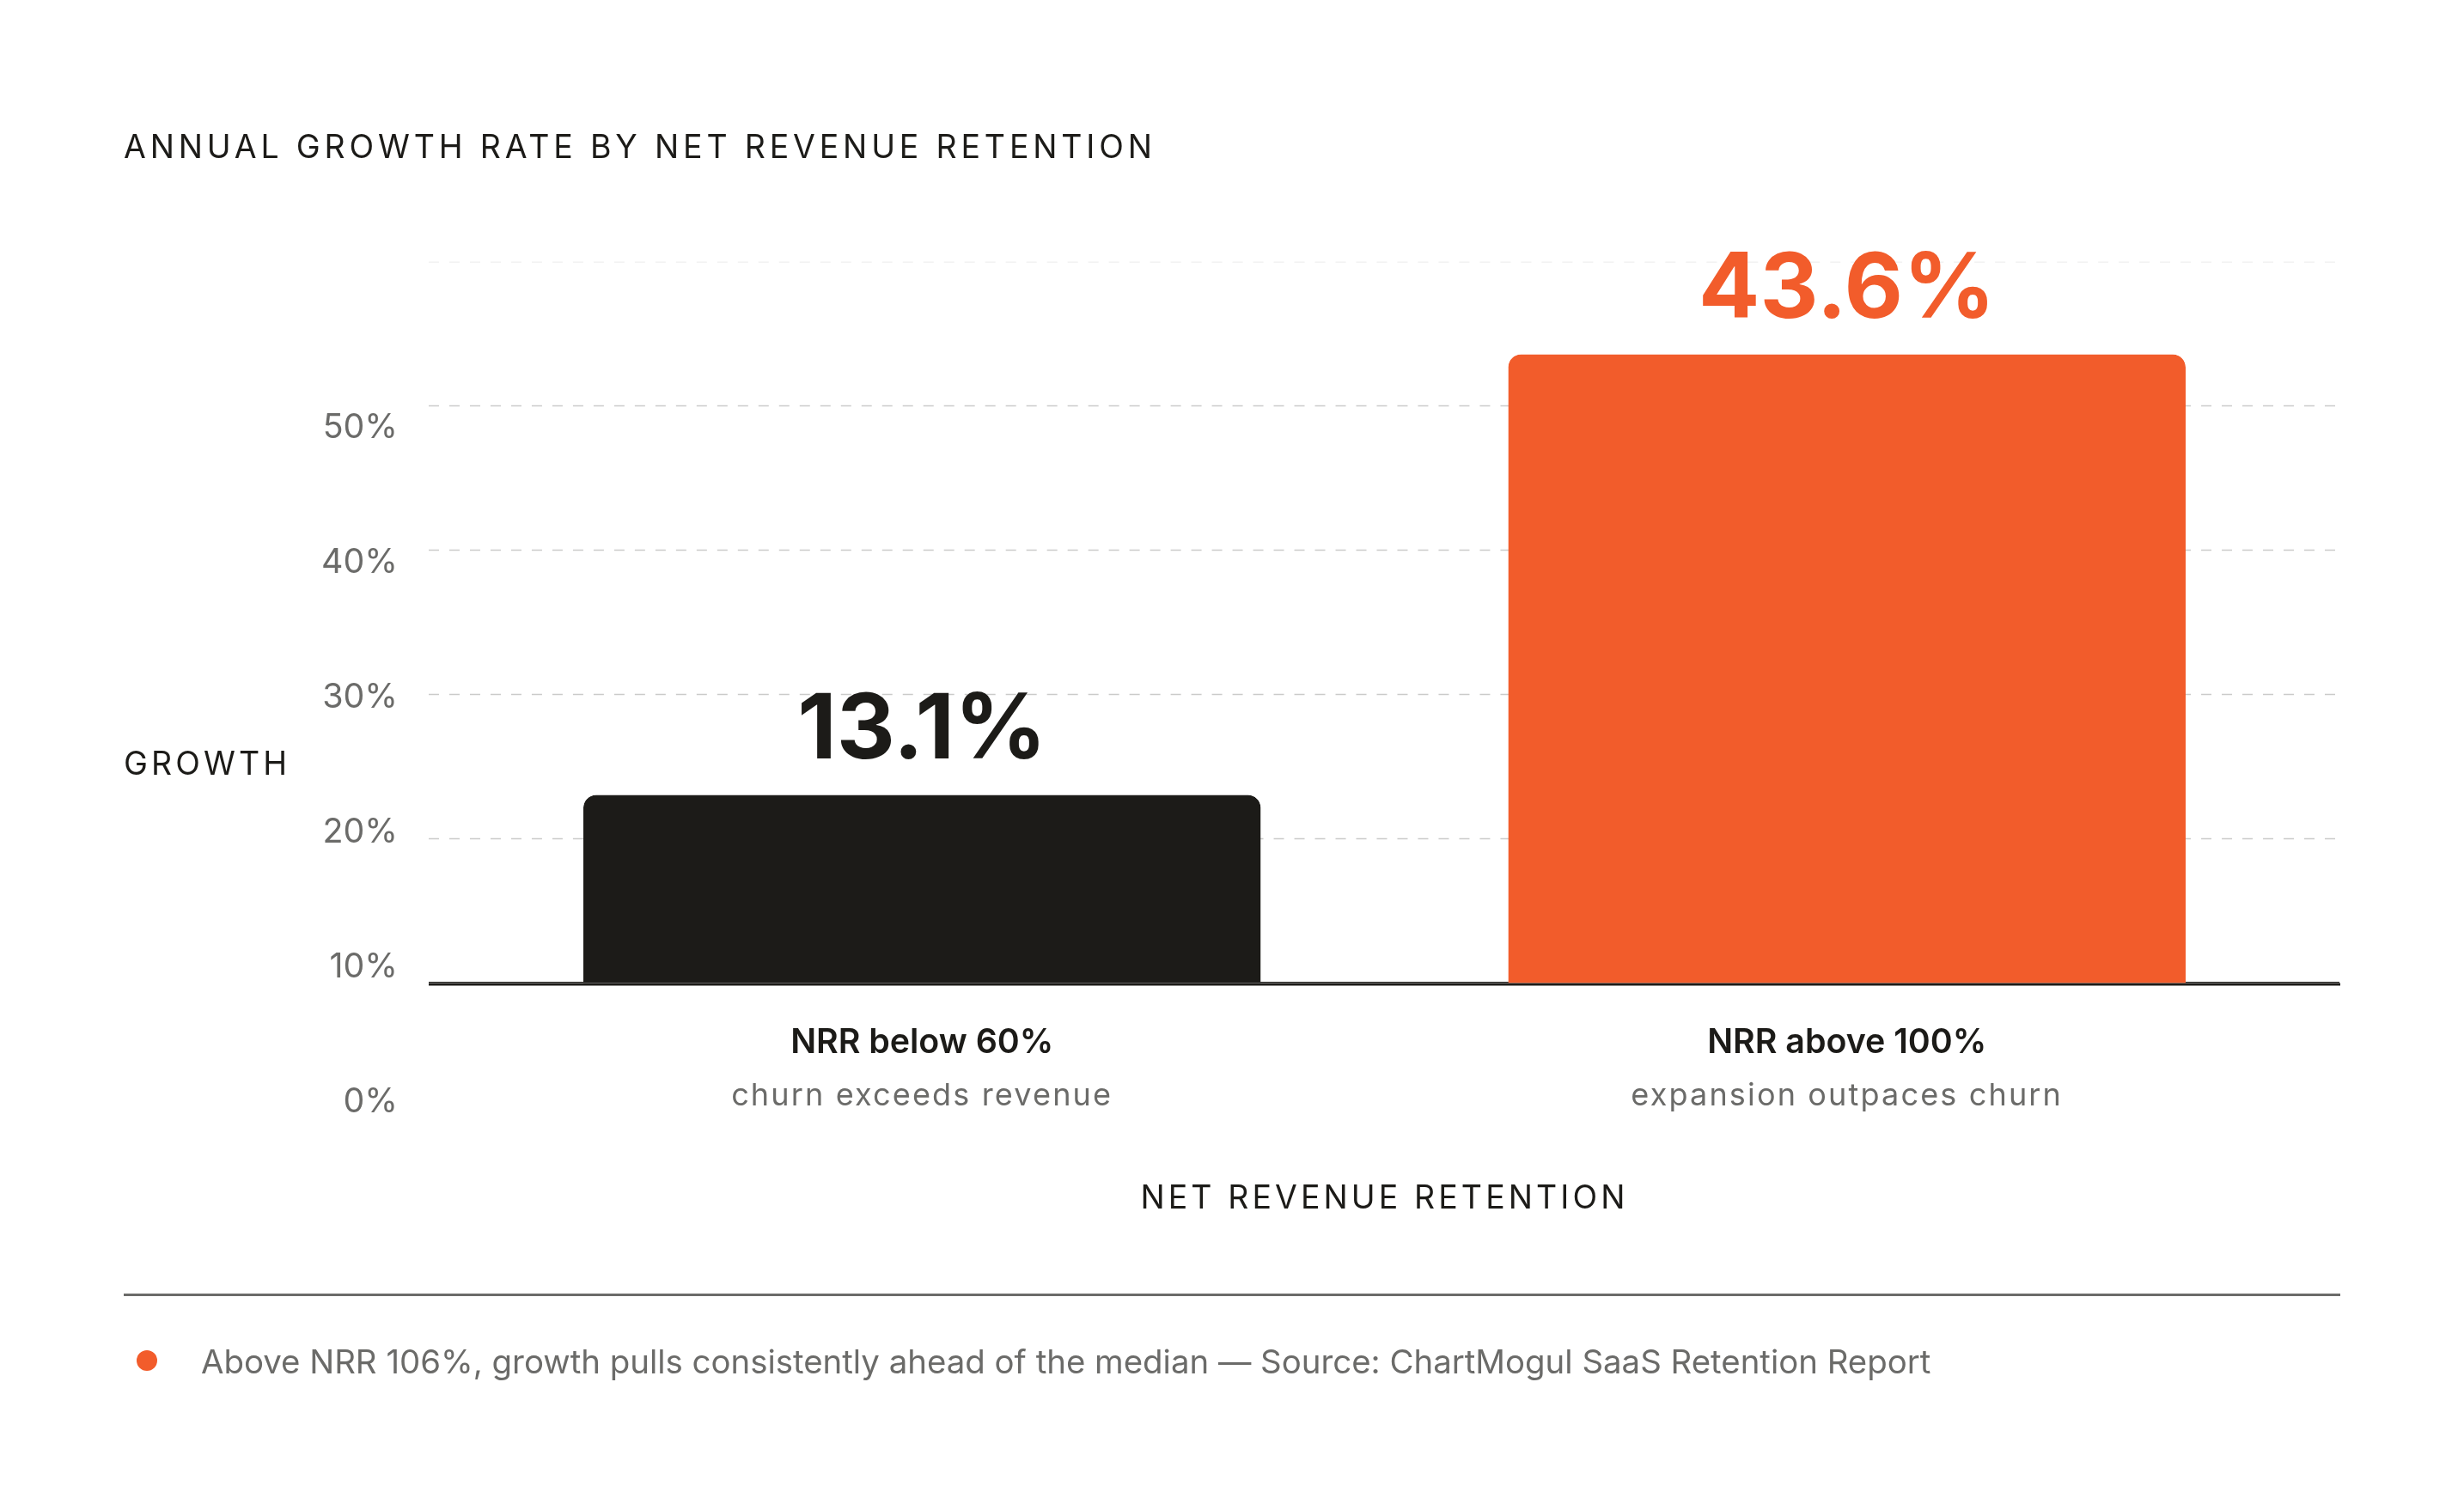
NRR is the closest thing SaaS has to a crystal ball. High Alpha's SaaS Benchmarks Report found that companies with high NRR grow several times faster than their low-NRR counterparts, and once NRR crosses 106%, growth consistently pulls ahead of the median.
ChartMogul's SaaS Retention Report puts numbers on how wide that gap gets: businesses with NRR above 100% grow at 43.6%, while businesses with NRR below 60% grow at just 13.1%, a gap that widens dramatically over time. That gap is visible early, in company performance, not just at scale. The best B2B companies grow revenue 13% to 30% a year from existing customers alone, before a single new logo gets signed. That growth comes from people who already trust the company enough to have a contract with it, and are expanding that contract on their own.
NRR above 100% means the customer base is quietly growing itself: upsells, cross-sells, seat expansions, all outpacing whatever churn and downgrades take away. Think of it as compounding interest for a revenue line. It runs even when nobody adds fuel.
E-commerce and DTC retention: why 28-40% is the normal range, not a red flag
E-commerce and DTC brands typically retain 28% to 40% of customers, with repeat-purchase rate specifically hovering near 28%. Benchmarking that against SaaS numbers is comparing a sprint to a marathon and wondering why the sprinter looks tired at mile two.
Most e-commerce has no contract to break. A customer buys a candle once, loves it, never buys again, and technically hasn't "churned" at all, since there was nothing binding to begin with. Focus Digital's 2026 benchmarks put transactional e-commerce at 38% retention overall, with a median customer lifetime running roughly half that of a typical B2B SaaS subscription. The category accepts shorter relationships. That's the model, not a flaw in it.
Focus Digital dug into exit surveys to find out why customers actually leave, and price sensitivity and competition topped the list, with low differentiation a close second. Product failure barely registered. Customers leave because someone else had a better price, or a nearly identical product wrapped in a slicker ad on social media, not because the candle burned wrong.
Subscription media, streaming, and consumer apps: retention in the middle of the spectrum
Subscription media and streaming (SVOD) is in the middle of the pack, with 55% to 75% annual retention and monthly churn running 4% to 6%. That range is wide because it's really three different businesses wearing the same label, split apart by content library size, ease of cancellation, and sheer scale.
GetPerspective's 2026 numbers show the split clearly. Premium SVOD services averaged about 4.6% monthly churn in 2025. Specialty, niche services ran closer to 6.6%, since a smaller content library gives subscribers fewer reasons to stick around during a slow month. The largest platform in the category held under 2% monthly churn, and that gap says something real: scale and content breadth aren't a nice-to-have here. They're a moat smaller competitors structurally can't dig. Focus Digital's broader "Media" category shows 84% retention, but that number comes from retainer-based professional and trade media, not consumer streaming. Treating it as a streaming benchmark mixes up two businesses that just happen to share a label.
Mobile apps tell a starker story, and a genuinely brutal one. Only a fraction of users come back the day after installing an app. By day 7, that number drops to around 10 to 11%. By day 30, retention has fallen sharply across most categories, low enough to send a SaaS founder into early retirement out of sheer despair. Day 90 only holds up in categories built on habit: finance, fitness, subscription learning. Everything else fades, the way New Year's resolutions do around February.
Fintech and financial services: high headline retention with structural caveats
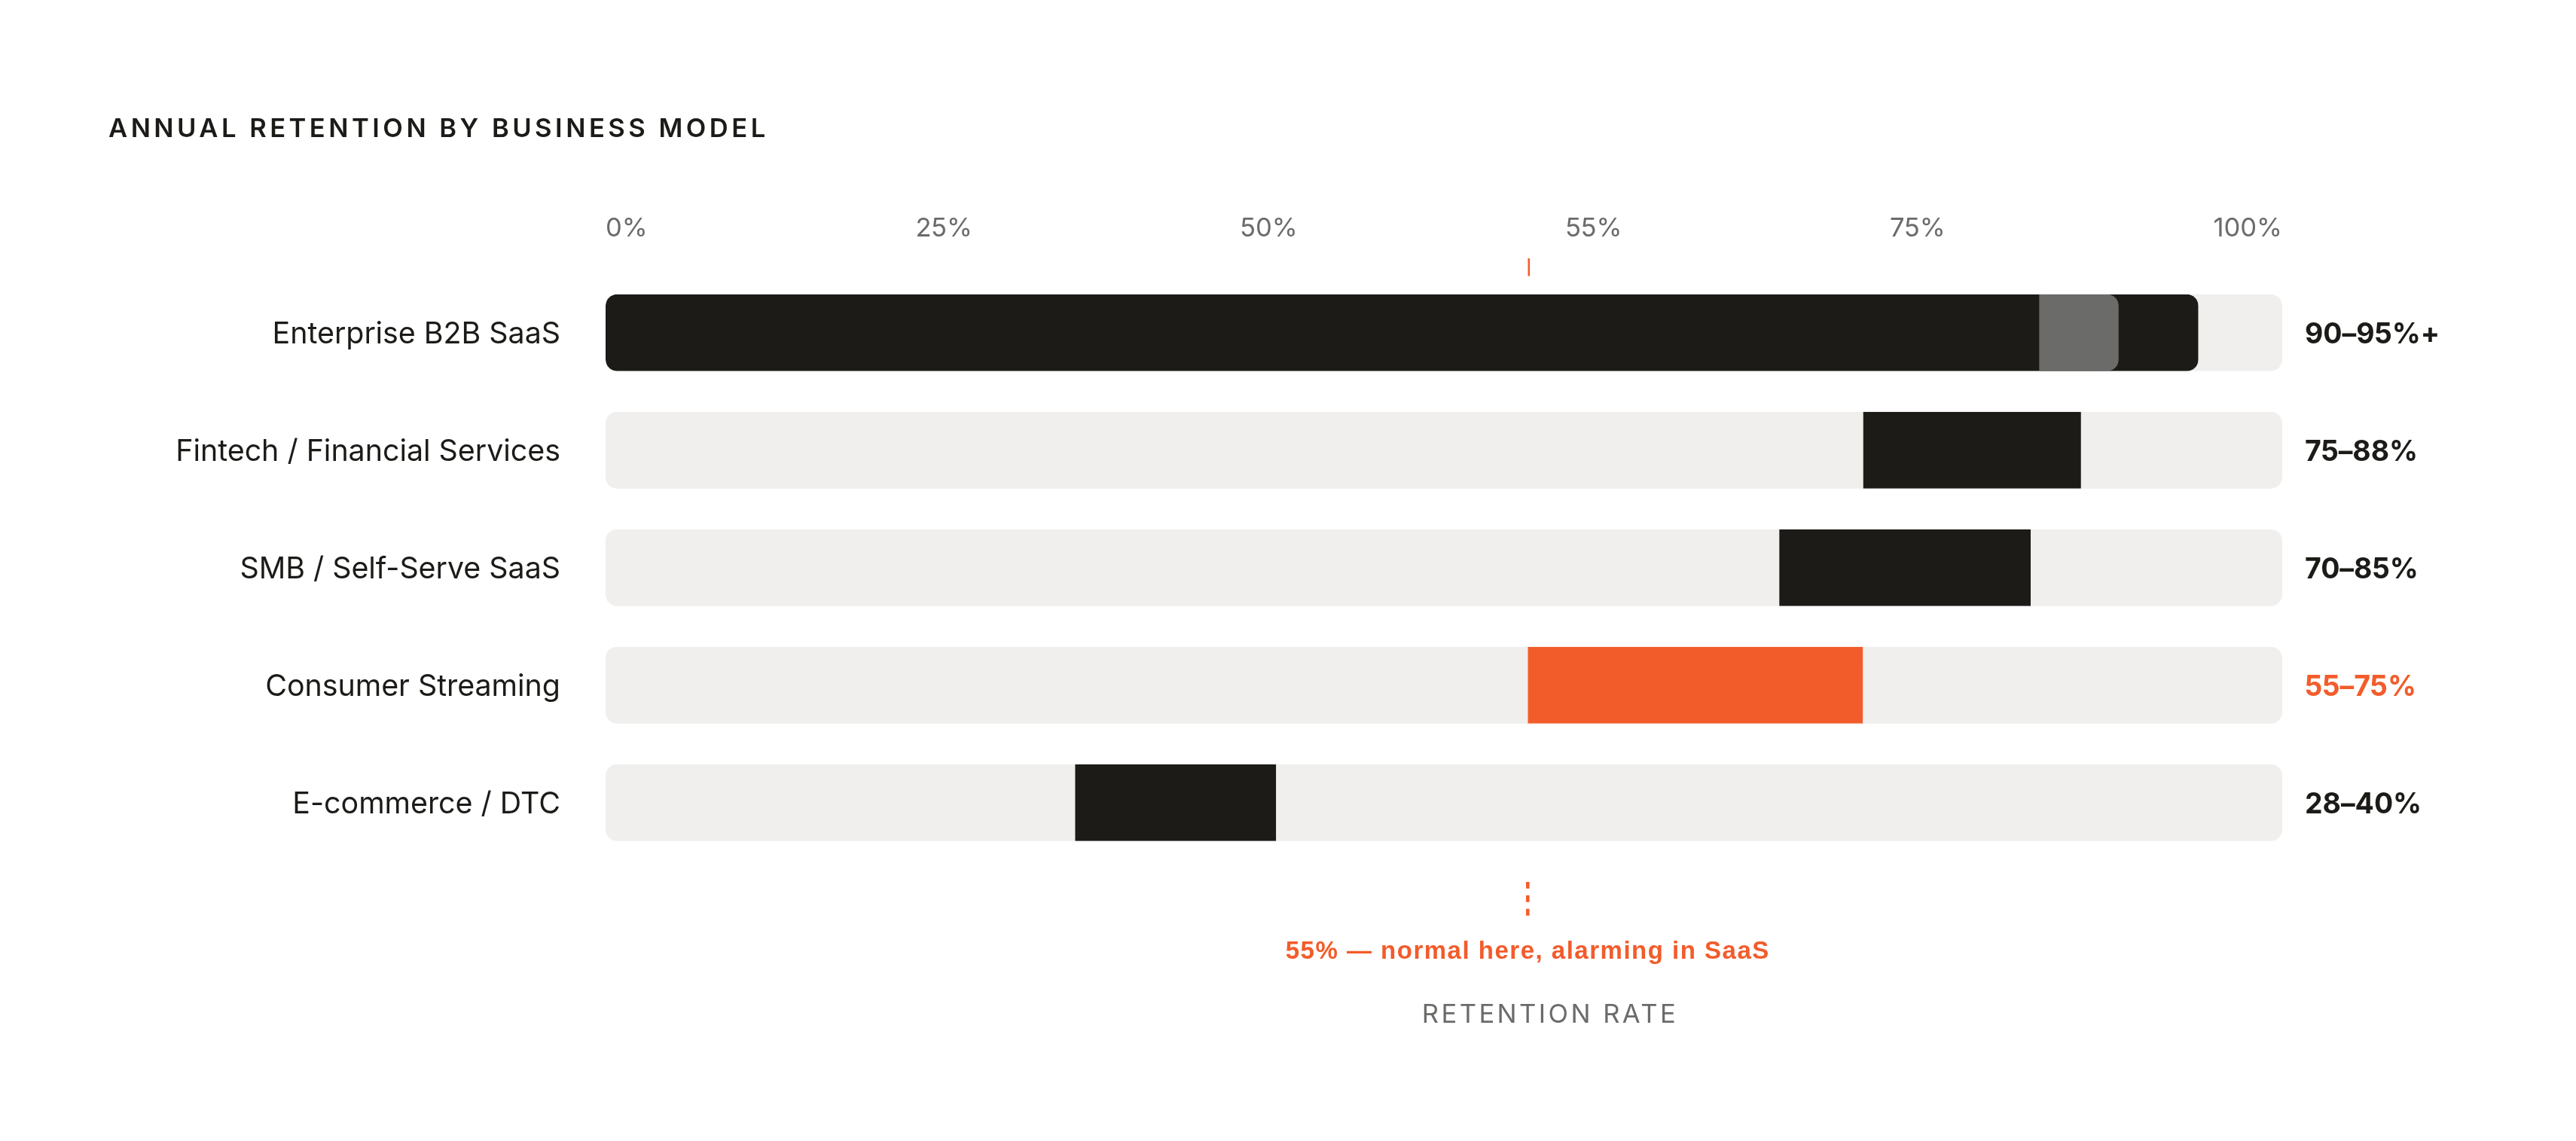
Banking retention runs 75% to 88%, among the strongest numbers outside SaaS, and the reason has less to do with delight than with inertia. Direct deposit and bill-pay create serious switching friction. Moving a paycheck to a new bank means updating a dozen automatic payments, and most people would rather reorganize a sock drawer.
CustomerGauge's benchmarks put financial services median retention at 81%, driven more by switching friction than by satisfaction with the product itself. That distinction matters, because friction-based loyalty is fragile in a way value-based loyalty isn't, and fintech has been leaning on the fragile kind for years.
Auto insurance makes the point well. Retention slid to roughly 78% in 2025, down about five points since 2021, as a record 57% of drivers shopped around for a new rate. Once switching got easier (comparison sites, apps, five-minute quotes), the loyalty everyone assumed was there turned out to be thinner than expected. Focus Digital's 2026 data shows financial services overall declining 1% year-over-year, as competitive pressure on traditional institutions continues to build. Friction bought time. It never bought loyalty.
Reading your retention number against the right benchmark
Get honest first about what's actually being measured. Logo retention, GRR, NRR, and repeat-purchase rate are not the same metric wearing different hats. Mixing them up is a category error. Comparing a SaaS company's retention rate to an e-commerce brand's repeat-purchase rate is like comparing a marathon time to a swim time and acting surprised one number is bigger.
The targets, by category:
Enterprise B2B SaaS should be 90 to 95%+ annual GRR. Anything under 85% needs a hard look at product or customer success gaps. SMB and self-serve SaaS should expect 70 to 85% annual retention, with 3% to 7% monthly churn tolerable so long as expansion revenue from existing accounts outruns the logo losses. E-commerce and DTC brands should expect 28% to 40% repeat-purchase rates, where the real signal is cohort trajectory over time, not any single snapshot. Consumer subscription and streaming products should be 55 to 75% annual retention, with 4% to 6% monthly churn as the median and anything under 2% seen only at the largest platform in the category. Fintech and financial services typically show 75 to 88% headline retention, but that number needs a second question behind it: is this friction, or is this real value?
Company size shifts the target too. A startup early in building its ARR shouldn't expect the same NRR or GRR as a company that scaled its revenue years ago. Comparing a seed-stage SaaS company to a mature platform's benchmark is measuring against the wrong ruler and calling it a stretch goal.
The real test is where the churn sits: at the level the category predicts, or above the category's own median. At-median churn in e-commerce is a shrug. At-median churn in enterprise SaaS is a five-alarm fire. Confusing the two is how founders panic over normal numbers, or ignore genuinely bad ones.
Why retention compounds into valuation and growth faster than most early-stage founders expect
Retention is a growth engine, and the mechanic behind it is simple. A company that keeps its customers spends less to defend the same revenue base, so every new dollar spent on growth stretches further.
Improving customer retention has an outsized compounding effect on growth and valuation, a range wide enough to span nearly every business model, because the compounding effect scales with margin and customer lifetime value. ChartMogul's data backs this up from the growth side too: companies with NRR above 100% grow at 43.6%, while those under 60% NRR crawl along at 13.1%. Retention is the single best predictor available of how fast a company will actually grow, better than headcount, better than funding raised, better than most of what gets celebrated in a pitch deck.
Yet only 18% of companies actively prioritize retention over acquisition. Most are still pouring the marketing budget into the top of the funnel while the bottom quietly leaks. That's a bucket with a hole in it and a bigger hose pointed at the top, and no amount of hose is going to fix the hole.
Sources
- Average Customer Retention Rate by Industry: 2026 Report - Focus Digital
- The 2026 SaaS retention benchmarks every founder should know | EverHelp
- Average Customer Retention Rate by Industry (2025)
- Customer Retention Benchmarks by Industry (2026)
- Customer Retention: The Complete Guide for Startups (2025 Edition) | Startupbricks
- B2B Customer Retention Statistics for 2026 (New Data) 📊
- userlens.io
- Net revenue retention benchmark SaaS: what the numbers actually mean for your stage