Data Analytics Stack for Pre-Series A Startups
Build a data stack that answers investor questions without burning engineering time or budget.

Before we get into tools and layers and connectors, here is the actual problem. Most guides to data infrastructure are written for teams that already have a data engineer, a six-figure tooling budget, and the luxury of time. You probably have none of those things. What you have is a product that needs to grow, investors you will eventually need to impress, and an engineering team whose time is the most expensive resource you own.
The goal before Series A is not a fully architected data stack. It is the minimum viable instrumentation that lets you make confident product and growth decisions without burning engineering time or budget. That's it. Everything else is a later problem.
There are two ways founders get this wrong. The first is over-building: engineering time disappears into data infrastructure instead of product. The second is under-instrumenting: you walk into a Series A meeting and you cannot cleanly answer a question about retention or activation. Both are real, both are common, and both are avoidable.
Here is what to actually do.
The Five-Layer Model You Will Eventually Need (and What Each Layer Actually Does)
Think of the modern data stack as a map, not a shopping list — data is a river, and each layer is a lock gate that moves it forward with purpose. Data flows through five layers, and each one does a specific job.
Ingestion moves data from your source systems. Product database, Stripe, ad platforms, whatever SaaS tools you're running. It takes that data and pushes it somewhere central.
Storage and Warehousing is that central place. Cloud warehouses like BigQuery, Snowflake, and Databricks separate compute from storage, scale without drama, and crucially, they don't touch your production systems. This matters more than it sounds.
Transformation cleans and reshapes raw data into tables that actually mean something. Raw event streams are not business metrics. dbt is the standard tool here. It's version-controlled SQL with documentation and testing baked in, which is just a fancier way of saying it makes your data trustworthy.
BI and Visualization turns modeled warehouse tables into dashboards your non-technical co-founder or board member can read without asking three clarifying questions. Mode, Hex, Looker, Tableau. All live in this layer.
Then there are two newer layers worth knowing exist, even if you don't need them yet.
The metrics layer (sometimes called the semantic layer) is where you define "monthly active users" or "MRR" once, in code, so every downstream tool agrees on the definition. Without it, your AI analytics tool and your BI dashboard can end up disagreeing on what revenue means. That becomes a problem fast.
Reverse ETL pushes enriched warehouse data back into your operational tools like your CRM or marketing automation. The warehouse stops just being a place where you look at things and starts being a place that drives action.
The key architectural point is this: the stack is composable. You do not implement all five layers at once. You add layers when complexity demands them. The October 2025 merger between Fivetran and dbt Labs is worth noting here as a signal. Even the companies most associated with the modular, best-of-breed approach concluded that assembling separate tools wasn't where the category was going. Consolidation is coming. Buy accordingly.
Instrument Your Product Before You Pick a Warehouse
This is the one thing you cannot do retroactively. If you don't capture an event when it happens, that data is gone. Permanently. You cannot go back and reconstruct whether your February cohort activated faster than your January cohort if you weren't tracking activation in February. Missing that data is like trying to read a book where someone tore out half the pages — the story is gone, not hidden.
Set up event tracking from day one. Even before you have a warehouse to send it to.
Your three main options at this layer:
- Segment: collects events and routes them to multiple downstream tools without requiring you to re-instrument. You track once, it goes everywhere.
- RudderStack: open-source alternative to Segment, lower cost at early stage, more ops work to maintain.
- PostHog: product analytics with event capture built in, self-hostable if data privacy or cost is a constraint.
Before you write a single tracking call, define your top ten metrics as a team. Not a formal governance document. Just explicit, written agreement on what "active user," "MRR," and "conversion" mean in your product. Divergent definitions surface later as arguments about whether growth is working. Resolve them in a shared doc now while it's easy and everyone's in the same room.
Start with five core metrics. MRR, churn rate, signups, activation rate, burn rate. These five answer the questions any investor or operator will ask first. If you can answer those five cleanly, you are ahead of most pre-Series A teams.
Which Product Analytics Tool Fits Where You Actually Are Right Now
Three tools dominate early-stage product analytics. The right pick depends on where you are, not where you plan to be.
Mixpanel is good for smaller user bases with straightforward funnel and retention reporting. Low setup overhead. Gets you answers quickly.
Amplitude is stronger when you need behavioral cohorts, user journey visualization, and retention analysis at higher data volumes. Worth noting: Amplitude's startup program offers a year of Growth plan features free for startups under $10M in funding with fewer than 20 employees. Their standard free tier covers 50,000 monthly tracked users and 10 million events. That is a material cost advantage at this stage.
PostHog is the all-in-one option: event capture, analytics, session replay, and feature flags in one tool. If data residency matters or you want to self-host, this is worth serious consideration.
Google Analytics is still the default for web traffic, understanding where visitors come from and how they engage with your site. It is not a replacement for product analytics. It is a complement.
Pick one product analytics tool and commit to it. Switching later means remapping your entire event taxonomy, which is exactly as painful as it sounds. Knock knock. Who's there? Your old event schema. Your old event schema who? Exactly — nobody remembers, and now you have to rebuild it from scratch.
What to defer: Looker, Mode, Hex, Tableau. These tools sit on top of a warehouse and add real value once you have modeled data. Before that, they are overhead pretending to be insight.
When to Add a Data Warehouse (and Which One to Start With)
You do not need a warehouse on day one. You need one when your product analytics tool can no longer answer your questions alone. In practice, that usually means you need to join product data with revenue data, support data, or marketing spend.
The specific triggers that tell you it's time:
- You need to correlate Stripe revenue with product behavior and you can't do it in a single tool.
- You're manually exporting CSVs from multiple tools and stitching them together in spreadsheets.
- You've hired a data-focused person and they have nowhere central to work.
If any of those are true, it's time.
The default recommendation for pre-Series A is BigQuery. Simplest to set up, cheapest at low query volume, generous free tier. Start there. Reassess at Series B: Snowflake if you need more cost control or multi-cloud flexibility, Databricks only if data science is a core product capability and not just an ops need.
One more thing worth understanding about cloud warehouses: they separate compute from storage and can be queried without touching production systems. This is the reason to move off direct Postgres queries for analytics even at small scale. Your production database has better things to do than serve your dashboards.
Why Buying Connectors Beats Building Them (and What the Math Actually Looks Like)

The ingestion layer is where the most early-stage engineering time gets wasted on data infrastructure. This is a solved problem and teams keep resolving it themselves anyway.
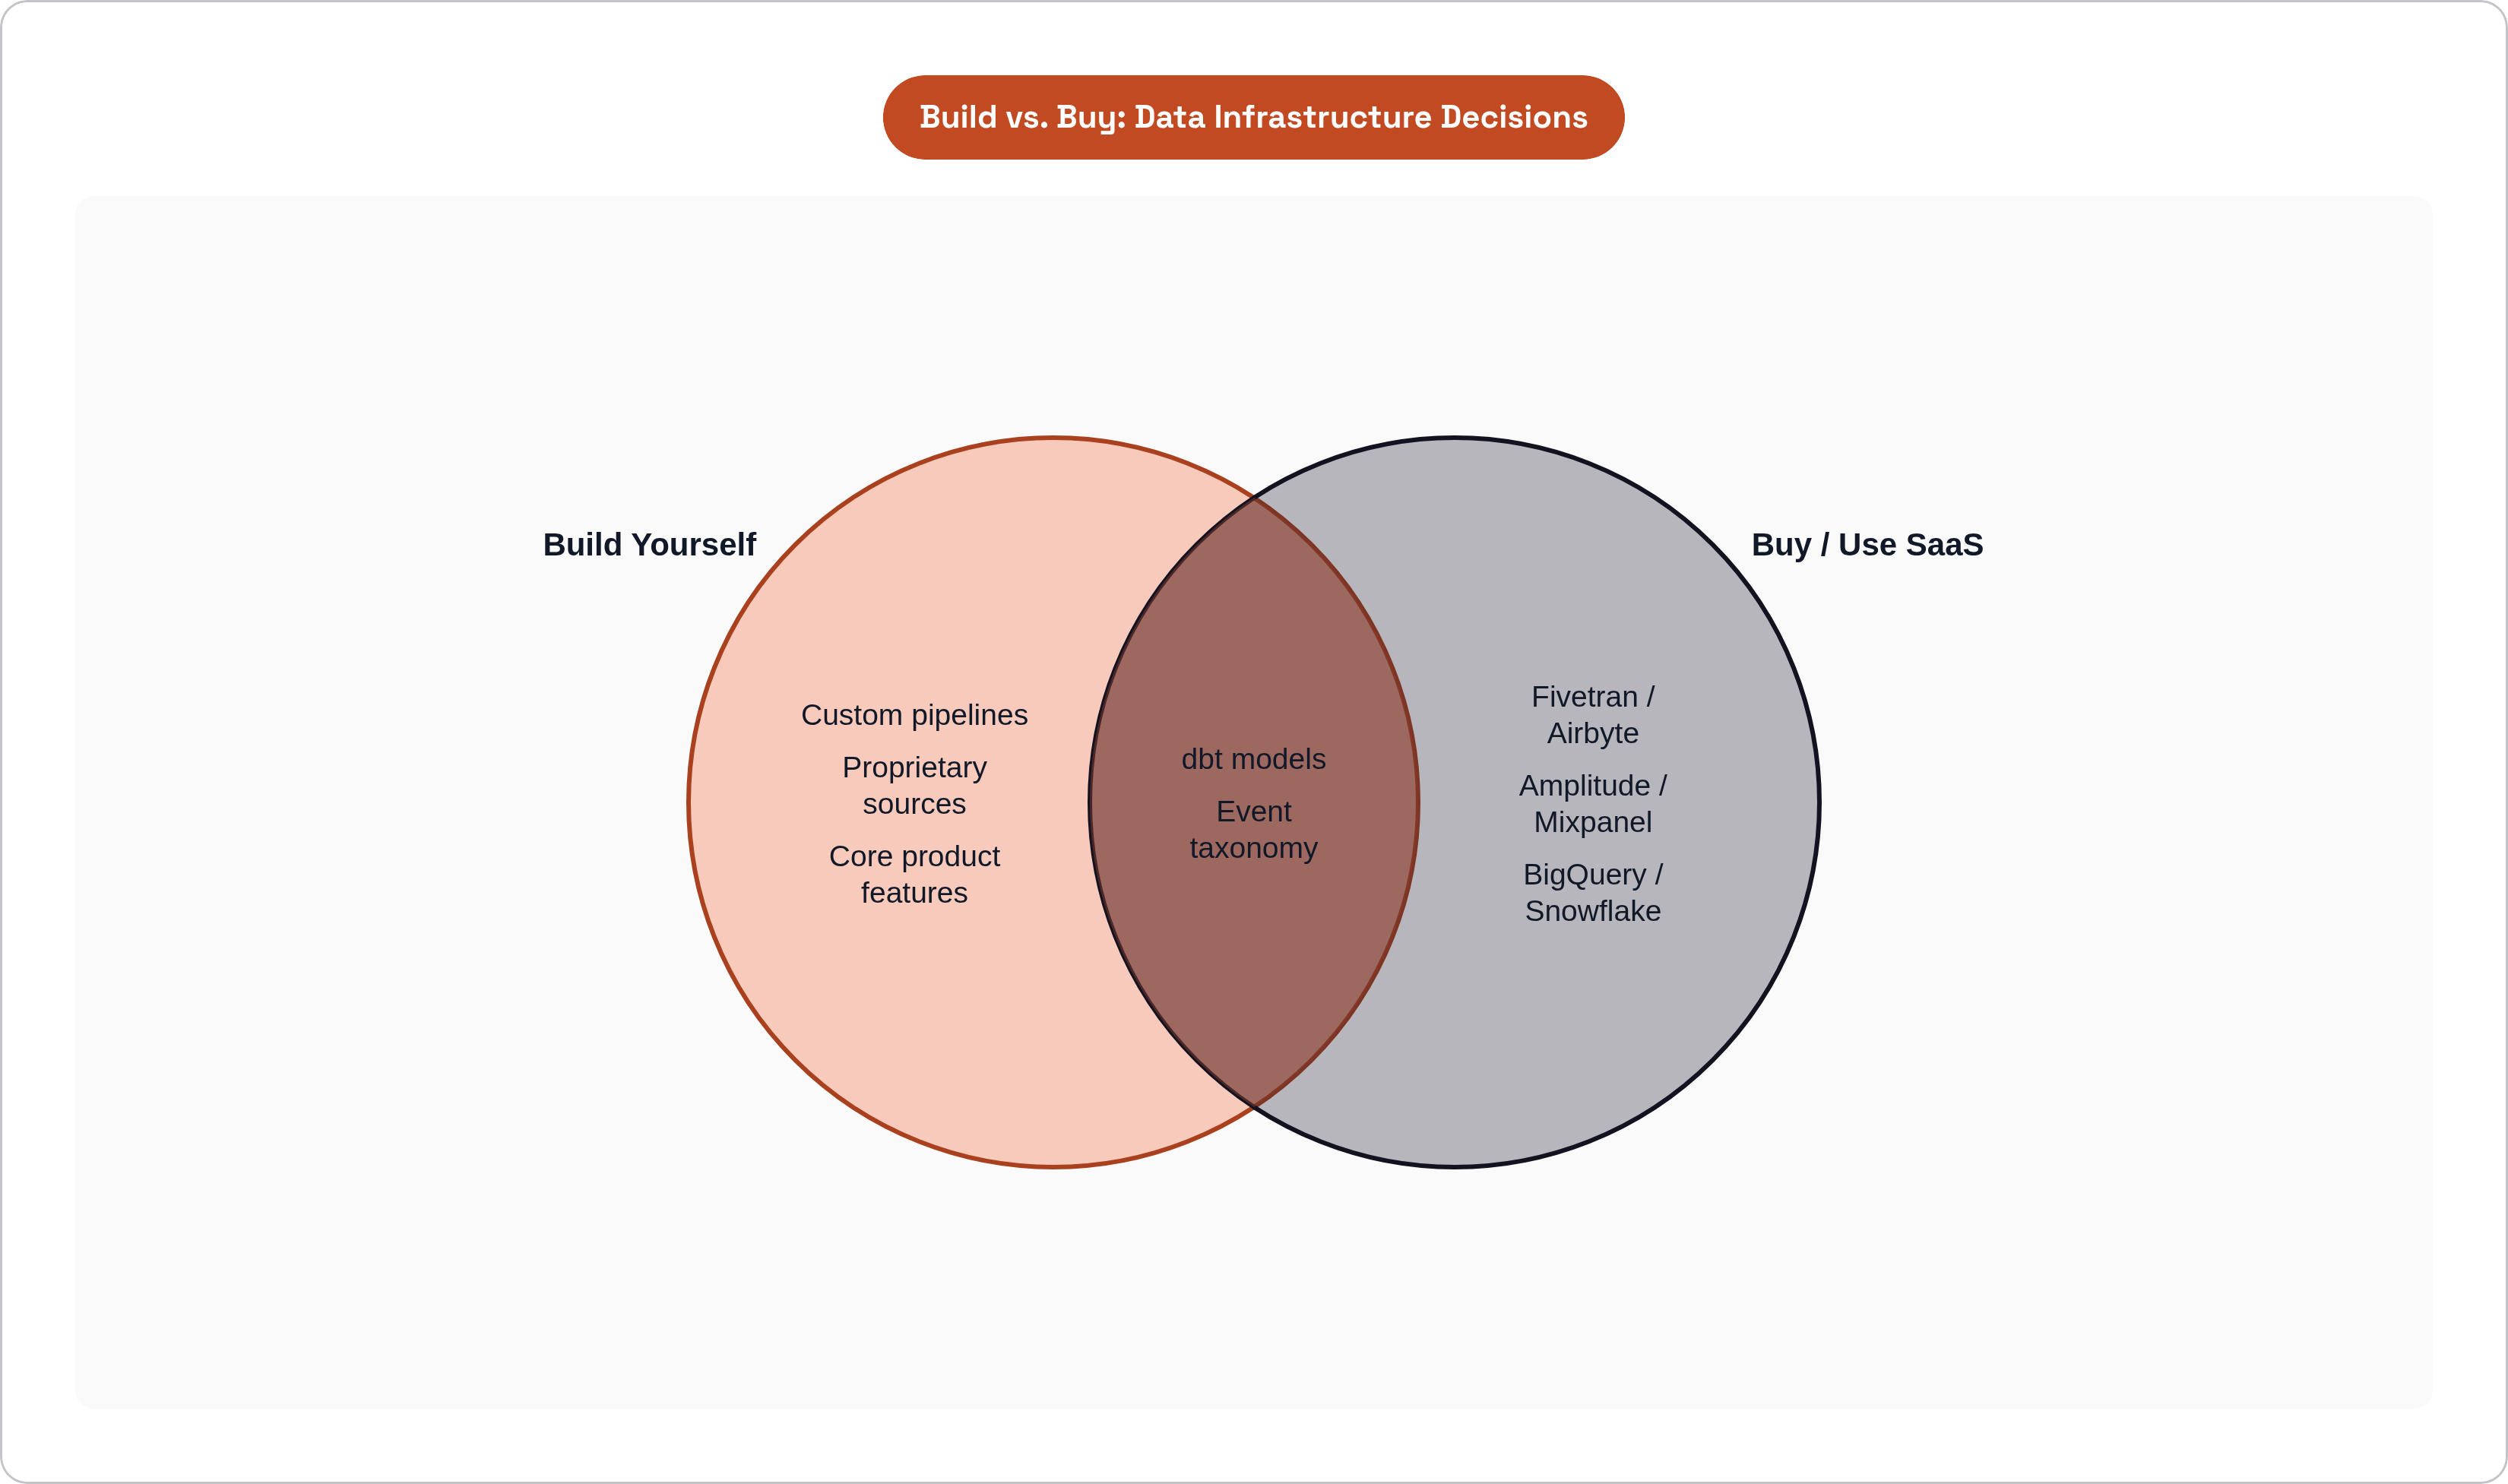
Practitioners report seeing startups spend $20,000 to $50,000 in engineering time building custom pipelines from Stripe, Salesforce, or HubSpot. Fivetran or Airbyte would replicate those same sources for $200 to $500 a month. The math is not close.
And the regret data supports buying. Around 29% of data teams reported regretting a build decision in the past year, versus 18% who regretted a buy decision. The majority now take a buy-first, build-selectively approach. The market has voted.
The rule of thumb: unless your source system is genuinely proprietary and has no connector, buy the connector. Your engineers should be building product features.
At early stage, the Fivetran versus Airbyte decision comes down to maintenance tolerance. Fivetran has more connectors, less maintenance work, higher cost at scale. Airbyte is open-source and self-hostable, lower cost, but requires more ops attention. Both are fine choices. Neither is a mistake.
One broader point worth calling out: the 2025 practitioner consensus is that how your pieces fit together drives more outcomes than which specific tool you pick in each category. Integration architecture matters more than tool selection. Keep that in mind when you're tempted to optimize for the "best" tool in a category versus the one that plays nicely with everything else you're running.
Transformation and the Metrics Definition Problem You Will Hit Before Series A
You can skip transformation early. You cannot skip it forever.
Raw event streams and source tables answer narrow, specific questions. Modeled data (user-session tables, revenue tables, cohort tables) answers the questions that come up over and over across product, growth, and finance. Transformation is what gets you from one to the other.
dbt is the de facto standard. Version-controlled SQL, documented data models, built-in testing. It runs on top of your warehouse and produces tables that BI tools can query reliably. It makes the data trustworthy in a way that raw tables simply aren't.
But here is the thing that gets founders before Series A, before transformation is even fully relevant: the metrics definition problem.
MRR is defined one way in your product dashboard. Another way in the spreadsheet you send investors. A third way when someone asks your AI analytics tool. Nobody notices until someone asks a pointed question in a meeting and three people give three different numbers with complete confidence. Three people, three numbers, one very uncomfortable room — that's not a data problem, that's a definition problem wearing a data problem's clothes.
Without governed definitions, AI analytics tools are guessing at what "revenue" means. Accuracy on complex queries can drop as low as 50% without clear definitions. With a proper semantic layer in place, accuracy improves dramatically. You don't need a full semantic layer before Series A. But you do need a single authoritative definition for your five core metrics, written down, agreed on, and used consistently.
Add dbt when your pipeline count exceeds what you can manage manually and when raw tables are being queried directly by multiple people with different levels of SQL skill. That combination is a recipe for conflicting answers and eroding trust in the data.
What to Skip Entirely Before Series A
This section is as important as everything above it.
Reverse ETL. Valuable when you have enriched customer scores you want to push back into your CRM. Not valuable when your CRM has 200 contacts and your marketing tool is Mailchimp. Defer until you have operational use cases that actually require it.
Orchestration tools like Airflow, Dagster, or Prefect. Necessary when you have enough pipelines that manual management breaks down. At pre-Series A scale with a handful of connectors and a small dbt project, it is overhead without payoff.
Enterprise BI tools. Looker and Tableau licensing and implementation complexity are sized for post-Series A teams with dedicated analytics engineers. Hex or Metabase get you 90% of the value at a fraction of the cost. Use those.
Custom pipeline development for standard sources. Already covered in the build-vs-buy section, but worth restating explicitly: if a connector exists, buy it.
The composability of the modern data stack is what gives you permission to skip these things. The architecture is designed to let you add layers when you need them. That is not a compromise. That is the point.
The Instrumentation Your Series A Conversation Will Actually Require
Series A investors ask a small set of questions. Your analytics stack either can or cannot answer them. There is no in-between.
The questions:
- What is your MRR and month-over-month growth rate over the past six to twelve months?
- What is your activation rate? What percentage of signups reach the moment that predicts retention?
- What is your churn rate, and how does it vary by cohort or segment?
- What is your CAC across channels, and what is the payback period?
The benchmarks investors use as a reference frame: target 20 to 30% monthly growth at early stage; median annual SaaS revenue growth hit 28% in 2025; annual churn below 5% is strong for SMB products, and 1 to 2% for enterprise.
If your stack cannot produce these numbers cleanly and consistently, that is the gap to close. Not adding a semantic layer. Not standing up orchestration. Not evaluating enterprise BI tools. Answer those four questions reliably, and you have done the job.
The minimum viable instrumentation checklist, synthesized from everything above:
- Event tracking live from launch. Segment, RudderStack, or PostHog.
- Five core metrics defined and agreed on in writing. Before you build anything else.
- One product analytics tool. Amplitude or Mixpanel at this stage.
- BigQuery when you need to join sources. Not before.
- Bought connectors for standard sources. Fivetran or Airbyte.
- dbt when raw tables are no longer sufficient. Not a day sooner.
Everything else is a later problem. And the discipline to defer it is exactly as important as knowing what to build.